


CropCheck data: a deeper dive

NRM
Agriculture
Crops across the country are approaching or are already at GS30-31. So, it’s time to get sampling to see if your crops are on track and recovering the nutrients they need for this stage in their growth.
Mentioned in my first CropCheck blog, crop tissue analysis isn’t always seen as routine, often only used when an issue with growth is seen in the crop. But understanding the nutrient status of an apparently healthy crop also has its benefits. Tissue analysis can be a useful tool in heading off potential deficiencies at the pass before they become an issue, and helping you assess the impact of the season you are dealing with. Being proactive with all approaches to nutrient analysis is one of the best ways of building efficiencies into our growing systems.
Life would be simple if we assumed that crop nutrient concentrations were similar between seasons. Fortunately, we do have critical ranges which, to a degree, account for seasonal influences. To check this theory and understand the degree of difference, NRM has completed a more in-depth review of the nutrient status of wheat crops sampled at the key growth stages. In this blog we will discuss GS30-31, with GS32-37 being considered in my next blog.
In my second CropCheck blog, we took a high-level look at the proportion of samples analysed that fell within the critical benchmark concentrations for the growth stage. The data suggested that more samples proportionately contained a higher concentration of nitrogen and phosphorus but lower concentrations of both potassium and magnesium. The seasonal conditions during the spring months (March, April and May) do have an impact on the availability of nutrients and influence the opportunities plants have to access them.
Comparison between the years
To test the impact of the seasons, NRM has looked at the variation in nutrient concentrations between different years. The statistic used to describe the nutrient concentrations analysed is the median value, which shows the central position of all values. The median is a good way of describing how well a dataset is distributed, particularly if the distribution is skewed. This is because it isn’t influenced by data outliers, unlike the average.
GS30-31
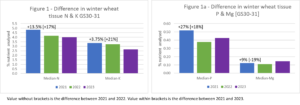
Figure 1 below shows the median nutrient concentrations for nitrogen and potassium, whilst figure 1a shows the concentrations for phosphorus and magnesium. The charts show the percentage difference between the years 2021-2022 and 2021-2023.
There is a general decreasing trend for nitrogen and potassium concentrations between 2021-2022 and between 2021-2023 at growth stage 30-31. This is also true of phosphorus, but magnesium concentrations were only lower between 2021 and 2022. In 2023 so far, more samples contain higher levels of magnesium compared to 2021.
The nitrogen concentrations at growth stage 30-31 are towards the upper end of the critical value range (CVR) in each year, particularly in 2021. This suggests that the crops analysed were well supplied and managed to recover what was available, despite the seasonal conditions at the time described below. In contrast, potassium concentrations skewed towards the bottom end of the CVR across all years, but in particular the 2023 season so far.
The lowest concentrations of both phosphorus and magnesium were found in 2022, measuring at the bottom of the CVR. However, the concentrations of phosphorus in 2021 were toward the top of the CVR and, again, this season (2023) the concentrations are also climbing toward the upper end of the CVR. Magnesium concentrations across all years are unfortunately languishing towards the bottom end of the CVR benchmarks.
It should be mentioned that some crops analysed would have been deliberately sampled to identify issues seen in the crop. But, overall, the trends indicate that crops by GS30-31 are either being over supplied by nitrogen and phosphate and/or undersupplied by potassium or magnesium.
It is also important to consider the extent to which nutrients are crop available at the time of crop sampling. Amongst a lot of these samples, nutrient availabilities may well have been influenced by other factors, such as soil pH, moisture, structure, texture, seasonal conditions, or an interaction of all these. These external factors are part of a dynamic system and can help explain if a nutrient is long term deficient or temporarily deficient, which can be more easily addressed.
Seasonal weather and climate effects
Seasonal conditions are a major influencer of nutrient availability. Each year, the Met Office publishes summaries of the weather experienced across the UK during the spring months and how it compares to the long-term average. In early March 2021, when crops were going through the foundation stage of their growth, it was notably cold. As the month progressed, air temperatures increased, and the monthly average ended up being nearly 1 degree warmer than the long-term average.
Samples taken and analysed at the beginning and end of the March could have been legitimately impacted by the cold temperatures the crop experienced during that period. Deficiencies measured in the crop could have been transitory, and it’s therefore critical that samples are taken at a time which reflects when the crop is, or should be, actively growing.
Rainfall in March 2021 was also slightly lower than average. To make things worse, April was the driest since 1980, with the UK receiving only 28% of the average rainfall usually expected. Soil moisture is critical if available nutrients are able to get into the crop. Drier conditions reduce and delay the likelihood of this happening.
Interestingly, Spring 2022 was warmer than average by up to 1ᵒC, partly due to the daytime temperatures in March and night-time temperatures in May being higher than the long-term average. There were some cold nights and late frosts in April but, overall, the daytime temperatures were mostly just above average. Spring rainfall again in 2022 was at a premium, but there were regional differences. Scotland, for example, was particularly dry, recording only 68% of the UK’s average rainfall in total.
In both years, early Spring delivered challenging conditions for crop growth, undoubtedly affecting nutrient availabilities, and crop recovery. The swings in diurnal and rising temperatures not only in the day but also during the night would have affected crop productivity. Night-time temperatures are reportedly increasing at a greater rate (1.4 times) than daytime temperatures. A Nottingham University report suggests that there is an approximately 7% decrease in yield for every 1ᵒC increase in night-time temperature. Investigating the broader impact temperature has on the nocturnal activities plants perform should shed light on how these processes affect productivity and system resilience in a changing climate.
In the fourth blog of the series, I shall be sharing the data analysis from wheat samples sent to NRM from GS32-37.
Send in samples for CropCheck today
CropCheck is available for a broad range of cereal crops including winter and spring barley, winter and spring wheat, winter and spring oats, and rye. Growth stages range from GS30 to GS37. NRM provides a sample kit which contains everything needed to place an order for CropCheck analysis. This comes with an analysis request form, sample bags, sample posting envelope, and full instructions on how samples should be taken, prepared, and despatched to the laboratory.
Results are reported in an easy-to-understand visual format so nutrient adequacy can be determined quickly. Interpretation is also provided to guide why nutrients might be high or low. You can order your kit through your agronomist or you can order here. Alternatively, contact NRM customer services on 01344 886 338 or at enquiries@nrm.uk.com.
References
The effects of increasing night time temperatures on plants – Future Food Systems (nottingham.ac.uk)
Visit NRM