


CropCheck data: a deeper dive part 2

NRM
Agriculture
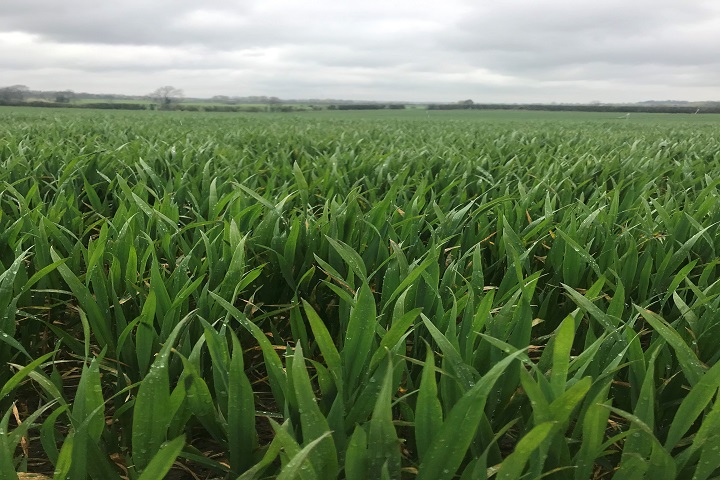
Since my last blog, the weather has been quite bright and sunny but interspersed with rain. This was brought about by the arrival of low pressure at the end of the Easter break. Overall, this has meant that crops have been thriving, particularly because farmers have been applying fertiliser, and crops are responding well. Regionally, wheat growth stages will vary but at this time in April crops should be at GS30 at the very least. Many may be well beyond this in varying stages of stem extension.
The good news is that there is more than enough time to diagnose and correct any issues observed, keeping crops on track to reach their optimal yield and meet quality targets. To continue the CropCheck story of how well crops have previously been supplied with nutrients, NRM has been reviewing the wheat data—this time, for crops at GS32 and 37. This blog reviews and compares data across and between the years 2021 and 2022.
Click here to read my previous blog where I talked about the median nutrient concentrations of wheat crops at GS30-31, as well as how the data compared against the critical value range (CVR) benchmark for the growth stage. In early spring, and as we progress through April and into May, the seasonal conditions will undoubtedly influence the plant’s ability to recover available nutrients. To lessen the impact of seasonal challenges outside of our control, our soils need to be kept in good health and managed so they can better cope with what mother nature decides to dole out.
Whilst not always easy, keeping soil health and function at the centre of our farming operations means we have a fighting chance to protect crop productivity. Building resilience in our soils must be the way forward.
Why should we analyse crops at different growth stages?
There are many advantages to growth stage specific analysis. The principle benefit of closely matching nutrient supply with demand results in greater nutrient efficiency. Nutrient efficacy, which describes how effectively nutrients are taken up and utilised by the crop, is vital if we are to get the most out of inputs and capitalise on these economic and environmental benefits.
If you see an issue in the crop today, then correcting the problem should be straightforward: you can adapt your nutrient management plan (NMP) to account for the gap in the nutrient supply in-season. NMPs should be designed to be amended and ought to exist as a living document, ever evolving to ensure you get the most out of the inputs you are applying. Tissue analysis can highlight more longer term issues that need a longer term plan if nutrient supply is to be sustained. This probably also means undertaking more soil analysis in the autumn to work out what isn’t in balance and determine the best course of action. Ultimately, analysis is to augment decision making and make us aware of issues before they become a real problem.
GS32-GS37: a comparison between the springs of 2021 and 2022
To test the impact of the seasons, NRM has looked at the variation in nutrient concentrations between different years. The statistic used to describe the nutrient concentrations analysed is the median value, which shows the central position of all values. The median is a good way of describing how well a dataset is distributed, particularly if the distribution is skewed. This is because it isn’t influenced by data outliers, unlike the average.
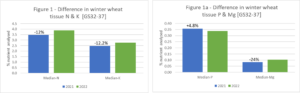
The two charts above describe the nutrient concentrations measured in wheat as crop growth develops between GS32-37. As the season progressed, the CVR benchmarks decreased as expected. Interestingly, for both nitrogen and potassium an increase in their concentration was measured in 2022 compared with 2021. This is converse to the earlier analyses at GS30-31 in blog #3. The nitrogen concentrations in both years were still towards the upper end of the CVR, but the opposite was true for potassium, which skewed towards the lower end of the CVR. This suggests that either supply or availability was limiting crop uptake.
Phosphorus concentrations in 2021 were slightly greater compared to 2022, but in both years the levels were towards the bottom end of CVR benchmarks. Magnesium levels flipped compared with phosphorus, with levels 24% lower in 2021 compared to 2022. In both years, once again levels were either below (2021) or slightly above (2022) the lower CVR benchmark.
What does this all mean?
There will always be fluctuations in nutrient supply and availability because the systems we are monitoring and managing are incredibly dynamic and intrinsically interrelated. The above data suggests that the year and the seasonal weather patterns during the key spring months (March, April and May) contributed greatly to the fluctuations in nutrient supply, availability, and crop uptake. This is not news exactly—we know how reliant our systems are on stable environmental conditions—but reflecting on how seasonal factors influence the ebbs and flows of nutrient dynamics can inform our management decisions for the remaining spring and period in which nutrients are applied.
This data also suggests that we can better target nutrients such as nitrogen and phosphorus because wheat crops between GS30 and GS37 do seem very well supplied. However, magnesium and, surprisingly, potassium levels show the opposite. As crops aren’t containing the nutrient levels required at key growth stages, this could be limiting yield and quality and reducing the nitrogen use efficiency (NUE) within the plant.
NRM intends to draw out further insights from the CropCheck data, connecting the dots between the soil, the plant, the grain, and the season. The more we can learn, the more we can adapt and farm more effectively and efficiently.
Later in Spring
Briefly reminding ourselves of the weather patterns in the spring of 2021 and 2022 can help us contextualise the results.
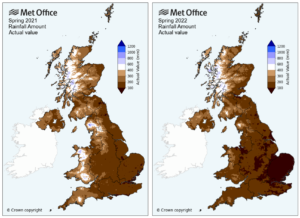
April 2021 was the driest since 1980, but May 2021, in contrast, was unsettled and cold except for a few days. In fact, May of that year ended up being a dull and very wet month, punctuated with spells of very heavy rain, particularly in Wales and the southwest of England. This pattern of very dry followed by very wet weather would have impacted nutrient recovery and growth rates during this period, which in turn influences the nutrient concentrations NRM measured.
Late spring in 2022 saw mostly warmer than average temperatures, which progressed into a very hot and dry period later in the summer, as shown in the maps from the Met Office below. Most of the rainfall last Spring came during early April, which would have sustained crop growth somewhat until the hotter temperatures began to take effect.
Reflecting on these Spring conditions can help us to work out how well our crops previously coped with the conditions of the year. Using CropCheck in season is a good way of understanding how well your crops are dealing with the here and now so you can make insightful management adjustments if necessary before it’s too late.
Send in samples for CropCheck today
CropCheck is available for a broad range of cereal crops including winter and spring barley, winter and spring wheat, winter and spring oats, and rye. Growth stages range from GS30 to GS37. NRM provides a sample kit which contains everything needed to place an order for CropCheck analysis. This comes with an analysis request form, sample bags, sample posting envelope, and full instructions on how samples should be taken, prepared, and despatched to the laboratory.
Results are reported in an easy-to-understand visual format so nutrient adequacy can be determined quickly. Interpretation is also provided to guide why nutrient levels might be high or low. You can order your kit through your agronomist, or you can order here. Alternatively, contact NRM customer services on 01344 886 338 or at enquiries@nrm.uk.com.
References
https://www.metoffice.gov.uk/research/climate/maps-and-data/uk-actual-and-anomaly-maps
Visit NRM