


Why spring crop nitrogen matters in soil nitrogen supply calculations

NRM
Agriculture
Accurate nitrogen planning starts with an accurate assessment of Soil Nitrogen Supply (SNS). This is very important for spring crop nitrogen.
For most advisors and farmers, the SNS calculation is familiar, but as a reminder:
SNS = Soil Mineral Nitrogen (SMN) + mineralised organic N + spring crop nitrogen
The first two components — SMN and mineralised organic nitrogen — can be measured in the lab or estimated using RB209 guidance. However, the third component, spring crop nitrogen, is often misrepresented or overlooked entirely. This omission can lead to:
- Under- or overestimation of SNS
- Inaccurate fertiliser recommendations
- Reduced crop performance
- Poor nitrogen use efficiency (NUE)
- Increased environmental risk.
In reality, the nitrogen already taken up by the crop in early spring is a crucial part of the soil-plant nitrogen system. Ignoring it means ignoring a major pool of nitrogen that directly affects how much spring applied nitrogen is actually required.
The crop is a key component of the Soil Nitrogen Supply system
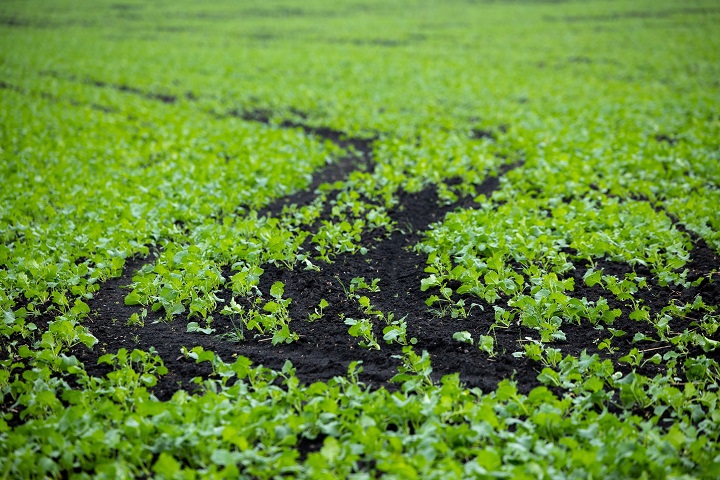
By early spring, many crops, particularly winter cereals and oilseed rape, have already taken up significant quantities of nitrogen from the soil. This nitrogen is no longer in the soil profile, but it did originate from the soil mineralisation processes. It represents soil nitrogen that has already been mobilised, mineralised, and taken up by the crop.
Measuring only soil SMN and estimating organic nitrogen release misses the nitrogen already taken up by plants during autumn and winter. This is especially relevant in 2026, as many autumn-sown crops were planted under near-perfect conditions. As a result, these crops established well and continued to take up SMN until growth slowed with falling temperatures.
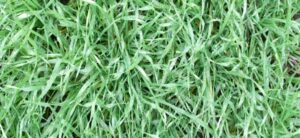
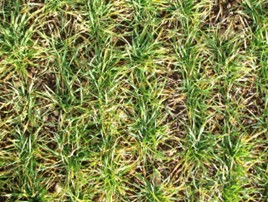
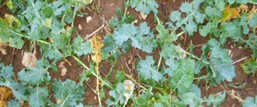
In many parts of the UK, cereal crops are significantly larger this spring due to favourable autumnal conditions. The following images of crops taken in the Northwest of England illustrate the impact of crop nitrogen on the SNS:
| Winter wheat – 2000 tiller/m2 = 60kg N/ha |
 |
| Winter barley – 1400 tiller/m2 = 45kg N/ha |
 |
| Winter Oilseed rape – 0.86 GAI = 45kg N/ha |
 |
These values represent nitrogen already supplied by the soil.
The impact of spring crop nitrogen on Soil Nitrogen Supply (SNS)
Including crop nitrogen can significantly alter the SNS Index and final fertiliser recommendation. In fact, two fields with similar SMN values can produce very different total SNS calculations once crop nitrogen is included.
| Table 1 – Impact of SNS | Crop N | SMN + Est Organic N | Total SNS | 1SNS Index | 2Nitrogen requirement |
| kg N/ha | kg N/ha | ||||
| 3Winter Wheat (8t/ha) | 60 |
20
|
80 | 1 | 220 |
| 3Winter Barley (6.5t/ha) | 45 | 70 | 115 | 3 | 110 |
| WOSR
(3.5t/ha) |
45 | 50 | 95 | 2 | 160 |
1measurement method RB209 section 4: 2medium soil texture applied to all: 3feed cereal crops
Why spring crop nitrogen matters
- It reflects real crop growth and field conditions
Spring crop nitrogen is a direct indicator of:
- Soil nitrogen availability over winter
- Crop rooting and establishment
- Soil structure and drainage
- Weather impacts on crop growth and nitrogen retention.
In other words, it’s an indication of the dynamics of the soil-crop system and how much carryover nitrogen from harvest 2025 has been retained and therefore not lost entirely from the system.
Two fields with similar SMN and mineralised organic nitrogen levels can have very different spring crop N uptake values, depending on soil type, structure, drainage, and crop establishment. Including crop N captures this variation between different fields and provides a realistic picture of how the soil-crop system is functioning.
- It prevents overestimating spring nitrogen requirements
If the crop has already taken up 40-60kg N/ha by early spring, that nitrogen contributes directly to the crop’s total spring nitrogen requirement. Failing to account for it can lead to over-application of nitrogen fertiliser.
Over-application doesn’t just waste money. It increases the risk of:
- Nitrate leaching
- Lower nitrogen use efficiency (NUE)
- Nitrous oxide emissions
- Crop lodging (grain quality) & reduced productivity
An accurate SNS assessment provides the foundation for effective nutrient management planning and a platform for making informed decisions as the season progresses.
- It improves Nitrogen Use Efficiency (NUE) and environmental stewardship
An accurate SNS calculation helps determine:
- More accurate crop nitrogen requirements
- Potentially lower total nitrogen inputs
- Reduced fertiliser costs
- Better timing of fertiliser applications
- Improved matching of fertiliser rates and timings to crop demand
- Increased NUE
- Reduced environmental impact
- Only applying what the crop requires
- Reduced risk of nutrient losses
- Compliance with nutrient management regulations
- Stronger nutrient management records
- Evidence-based fertiliser decisions
Efficiency gains and resource management rely on more data-driven nutrient management plans. An accurate assessment of spring crop nitrogen uptake is essential, and spring crop nutrient measurement through laboratory analysis is a key part of that process.
How to estimate or measure spring crop nitrogen
Spring crop N can be estimated through:
- For cereals, shoot number per m2 can be used to estimate crop nitrogen content. Although individual tillers contain relatively small amounts of nitrogen, large crops can account for a third of the whole SNS.
|
Table 2 – Shoot Number m2
|
Crop nitrogen content
(kg N/ha) |
| Spring assessment | |
| 500 | 15 |
| 1000 | 30 |
| 1500 | 50 |
| 2000 | 60 |
(reference RB209 section 4, page 13)
- Measuring Green Area Index (GAI) in oilseed rape. The index system assumes that for every unit of green area, the crop contains 50kg N/ha.
| Table 3 – Green Area Index (GAI) | Crop nitrogen (kg/ha) |
| 0.5 | 25 |
| 1.0 | 50 |
| 2.0 | 80-100 |
- Laboratory analysis
For greater precision, crop biomass can be sampled and analysed for nitrogen and dry matter %.
Steps include:
- Cut a minimum of 3 known areas of above-ground biomass using a quadrat
- Record each fresh weight and convert the weight to kg/m2
- Take a representative subsample from each quadrat sampled
- Analyse for crop nitrogen concentration and dry matter %
Results are usually reported as a %N and %DM. To convert these data to kg N/ha, follow the formula below:
-
- Calculate the kg Fwt/ha: Crop Fwt kg/m2 *10000
- Calculate the quantity of DM kg/ha: (Fwt (kg/ha) *(DM%/100)
- Crop N kg/ha = DM (kg/ha) * (N%/100)
- Remote sensing or canopy reflectance tools. Satellite imagery uses indices such as NDVI to estimate crop size. By combining an estimate of crop greenness, crop nitrogen content can be calculated.
- A decision support app, such as the BASF GAI tool, can estimate the size of the crop from smartphone images.
Whichever method is used, the goal is the same: quantify the nitrogen already in the crop so the fertiliser plan reflects the true remaining requirement.
The bottom line
Soil Nitrogen Supply isn’t simply the nitrogen remaining in the soil. It also includes the nitrogen the soil has already supplied to the crop during autumn and winter.
Measuring or accurately estimating spring crop nitrogen during soil sampling makes SNS assessments more precise and relevant, providing a clearer, field-specific picture of nitrogen supply.
The result is smarter fertiliser decisions, healthier crops, and more sustainable nutrient management.
Need support with spring nitrogen assessment?
NRM will help you get the most out of your inputs.
Our N-Check and N-Check Plus analytical packages measure the amount of available nitrogen in spring. N-Check Plus also estimates the additional organic nitrogen that will be mineralised from soil organic matter during the growing season.
Contact NRM for more information or discuss how to go about soil nitrogen sampling with your agronomist.
Click here to order kits and learn more about our N-Check services.
References
AHDB RB209 section 1 and 4
RB209 Section 1 Principles of nutrient management and fertiliser use | AHDB
RB209 Section 4 Arable crops | AHDB
Visit NRM