


SOM #2: managing soil organic matter and carbon – an analysis of data

NRM
Agriculture
The links between soil organic matter (SOM) levels and soil texture are crucial to understanding effective farm management. There is a strong relationship between SOM, soil texture, and the soil’s capability to hold water, so it’s important to consider all elements when creating and implementing effective and sustainable soil management plans.
If you haven’t read my first blog on managing SOM and carbon, make sure you do before you read it before this one. Otherwise, read on for a deep dive into NRM’s SOM data from the last few years, as well as why texture and how SOM levels are important in helping boost crop productivity and safeguard the environment.
How does soil organic matter vary in different soil texture according to NRM’s data?
NRM has looked at soil analysis results where organic matter has been measured along with soil textural class. It’s interesting to view a bigger picture regarding how organic matter content is distributed within specific soil textures.

Sample numbers: Clay = 165, Clay Loam = 264, Silty Clay Loam = 98, Silty Clay = 56, Sandy Silt Loam = 52, Silt Loam = 285, Sandy Clay Loam = 78, Loamy Sand = 58.
The data in the charts above indicate how the SOM content varies within and between different soil textures. The point where the colour changes from dark to light green shows the median value. The median is a determined value where 50% of the observed SOM content levels were measured either below or above it and it is not affected by the extreme values or outliers. The lowest values were measured in soil textures that contain the least amount of clay, and the majority of SOM contained in loamy sand was between 2-3.5%. It did range up to 9.3%, but it was also found to be as low as 0.5%.
In clay-rich soils, most SOM content levels were between 4.3 and 11.3%, and the variation was generally more positively skewed toward higher SOM content levels, indicated by the light green colour on the bars. The lighter textured soils that included a higher clay or silt content contained higher SOM levels (4.1 to 7.7%) than those with less clay (2.1 to 4.5%), and overall were negatively skewed towards lower SOM contents.
These results represent the bigger-picture trends. Unfortunately, we do not know how the individual soils measured for SOM are managed, which is important because system management also influences the soil’s capacity to retain SOM.
An important aspect to note is the capacity of soil to build and retain organic matter and carbon depends on the amount of clay it contains. Clay minerals within soil fix carbon more permanently. This key factor affords soil organic carbon (SOC) protection from biological activity and the myriad of chemical processes happening within our soil.
It is of interest to view these bigger-picture trends and reflect on the interaction of soil texture and SOM content. Can we estimate the capacity of our soils from soil texture to build SOM? Knowing a soil’s texture and its capacity to build organic matter is important as it gives you a realistic aim and helps you recognise what management changes are needed to protect what it has the potential to contain.
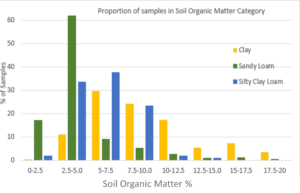
The following chart describes the same data in a slightly different way, showing the proportion of samples observed in a range of SOM categories. It is clear to see again that a larger proportion of clay soils contained higher amounts of SOM. Sandy loam soils had a greater proportion of samples containing lower SOM contents and silty clay loams were somewhere in between.
How do SOM levels affect nutrient availability and supply?
Managing SOM has many benefits for agriculture, one of which is soil nutrient supply. The following charts describe the relationship between the average SOM content and average available Phosphorus (P), Potassium (K), and Magnesium (Mg).
The results for available soil Phosphorus were interesting, as they showed an inverse relationship, where soils with the least amount of SOM had a greater availability. The heavier textured soils (clay and silt clay types) contained on average a higher SOM content but the lowest available Phosphorus content, whilst the lighter soils (sandy loam, loamy sand and sand) contained on average a low SOM content but a high available Phosphorus concentration. The medium soils were somewhere in the middle.
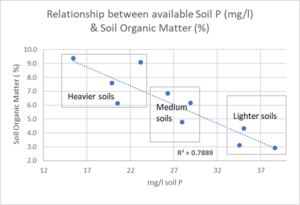
So, what is happening to create this inverse relationship? Organic amendments to soils are shown to enhance the availability of Phosphorus by reducing adsorption (the capacity of a clay mineral to attract molecules to its surface) and increasing desorption (releasing molecules from clay and oxide mineral surfaces). Organic matter, which is negatively charged, is readily adsorbed to any positively charged clay mineral and oxide surfaces, blocking the rate at which Phosphorus inorganic and organic compounds are adsorbed and resulting in more plant-available Phosphorus .
Lighter soils, by their nature, contain fewer clay mineral particles, and their organic matter content is lower. The opportunity for Phosphorus to be complexed is therefore lower, resulting in more plant-available Phosphorus.
Heavier and medium-type soils contain a much higher clay content, and typically SOM. So, Phosphorus can be readily complexed onto mineral surfaces and with other chemical molecules present in the soil. Studies have shown that soil with high SOM content can also increase the rate at which available Phosphorus is complexed, decreasing its availability. This phenomenon can be explained by complexes of Phosphorus to iron (Fe) and Aluminium (Al), and also where Phosphorus is strongly bound to organic carbon compounds. This data suggests that soils with a higher capacity to build and retain organic matter can also result in a reduction of plant-available Phosphorus. You can read more about this technical process in this publication by Jindo K et al.
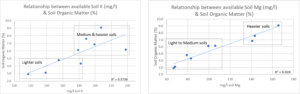
When we look at soil available Potassium and Magnesium, the picture changes. The relationship between SOM and soil available Potassium and Magnesium is positive. As SOM increases, soil available Potassium and Magnesium supply also increase, but there are two distinct groups depending on soil textural class. The lighter soils, which are lower in SOM and clay content compared to medium and heavier soils, are separated in terms of available Potassium supply, which is considerably lower. But in terms of Magnesium, the light and medium-textured soils group together and contain much less plant-available Magnesium compared to the heavier-textured soils.
Why might this be? Soil organic matter and clay particles are both negatively charged and therefore readily adsorb cations such as Potassium and Magnesium onto their surfaces. The greater the organic matter and clay content of the soil, the bigger the opportunity to retain these cations. The lighter soils contained the least amount of plant-available Potassium and Magnesium and the least capacity to build SOM compared to medium and heavier soil textures. It is this characteristic which enables clay-richer soils to maintain a greater total concentration of nutrients.
The strength of the relationship between SOM and the nutrient content is described by the statistic R2. This statistic suggests how well one explanatory variable explains the change in another. The closer the R2 value is to 1, the stronger the correlation between SOM and plant available nutrients. In the case of Phosphorus , SOM levels explained nearly 80% of the plant available Phosphorus , nearly 60% of the plant available Potassium and more than 90% of the plant available Magnesium.
The tables below describe the range in average available nutrient content from the NRM dataset range and the associated RB209 nutrient index.
Available Phosphorus (P)
| Soil texture group | Mg/l | Soil index |
| Heavy | 15-23 | 1-2 |
| Medium | 26-29 | 3 |
| Light | 35-39 | 3 |
Available Potassium (K)
| Soil texture group | Mg/l | Soil index |
| Light | 117-182 | 1 to 2 |
| Medium to Heavy | 179 – 238 | 2- to 2+ |
Available Magnesium (Mg)
| Soil texture group | Mg/l | Soil index |
| Light to Medium | 79-106 | 2 |
| Heavy | 141-166 | 3 |
Interestingly, despite the variability in available nutrient content due to the soil’s organic matter status, the supply is agronomically mostly on target. Some of the heaviest soils are at index 3 for Phosphorus and 2- to 2+ for Potassium. The soils at Phosphorus index 3 can be more problematic due to managing the risk of excess nutrients in the system.
The lighter textured soils range between the bottom of index 2 and towards the top of index 1 for Phosphorus and Potassium but, with a fair wind behind can still systematically produce good quality crops with high yields. For Magnesium, the light and medium soils are on target, but the heavier textured soils are in excess at index 3.
SOM content, apart from driving the supply of nutrients, has many functional benefits, all of which contribute to the sustainable production of food. Managing our soils for not only food production but carbon sequestration, climate and the wider environment are all topics which NRM are keen to visit in future blogs. So, watch this space!
NRM: here to help
Measuring soil organic matter and soil carbon couldn’t be easier. NRM’s CarbonCheck services include soil organic matter analysis to help you qualify for the SFI, improve soil health, and get a head start on your carbon capture journey.
Click here to contact us directly or speak to your adviser for further information.
References
Jindo et al. Chem.Biol.Technol. Agric: Biotic and abiotic effects of soil organic matter on the phytoavailablility of phosphorus in soils: a review. https://doi.org/10.1186/s40538-023-00401-y
Visit NRM