


Soil Organic Matter #6: new benchmarks to guide interpretation

NRM
Agriculture
Farmers throughout the UK are starting to measure soil organic matter (SOM) levels because of the new Sustainable Farming Incentive (SFI) scheme. For more information on the SFI and the rules that need to be followed for eligibility, read my expert guide here.
However, it’s not enough just to measure SOM. You must also understand what to do with the results to help benchmark and improve soil health for increased productivity.
There are several approaches to successfully measuring SOM. These methods were extensively discussed in my previous blog series back in June, but guidance for interpreting SOM results has been severely lacking until now.
Hot off the press, a new set of SOM benchmarks has been published by AHDB and BBRO to help guide farmers and advisers in interpreting laboratory results. The project concluded that all established SOM analysis methods are robust enough to detect changing trends over time. They can therefore be used for benchmarking soil health. Even so, sticking to the same method by the same lab is a major rule of thumb.
NRM is one of the first laboratories in the UK to actively publish these guidelines alongside SOM results. The benchmark values will accompany these results on a brand new easy-to-read report. This improves knowledge exchange and provides farmers and advisors with the latest guidance to help interpret their results more insightfully. By reviewing SOM trend data over time with benchmarks for guidance, detecting any changes will be far easier and establishing the right steps towards effective soil management much quicker. This is a game changer and should help individual farm businesses manage their carbon footprints whilst contributing towards meeting net zero alongside the rest of the industry.
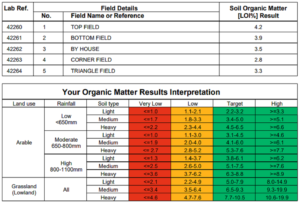
What are the benchmark categories for SOM?
The Soil Biology and Soil Health (SBSH) partnership, which developed the benchmarks, has worked with several existing datasets to produce typical SOM ranges dependent on soil texture and climatic conditions for crop and grassland. The benchmark values have been grouped so that the data is considered as either:
| Category | Benchmark Description | Action |
|---|---|---|
| 1 | Very low for the climate and/or soil type | Investigate |
| 2 | Lower than average | Review |
| 3 | On target | Continue rotational monitoring |
| 4 | Very high for the climate and/or soil type | Continue rotational monitoring |
These benchmarks couldn’t have been published at a better time. They should offer great decision-making support for farmers who have signed up to the SFI, which requires SOM measurement and soil management planning. Find out more about the SFI analysis options that NRM offers in our third Soil Organic Matter blog.
It’s important to say that these benchmarks have been developed by the industry for the industry. This helps to create a level playing field in terms of result interpretation and universal actions to manage soils more sustainably.
The benchmarks are also useful where SOM levels are determined to be very low for the climate region and soil texture. Knowing that a soil is degraded and to what extent means that appropriate actions for that scenario can be put in place.
Incidentally, there is no clear evidence in the report for a critical SOM value. The benchmark data ranges represent statistical boundaries for the defined rainfall and soil texture scenarios. It is most important to regularly feed the soil with organic inputs to support its functionality, rather than aiming for a specific measured critical value.
What are the benchmark limitations?
The benchmarks that have been developed only apply to mineral soils in arable and lowland grassland situations. It is important to note that they are not applicable to peats and organic soils where organic matter content is more than 20% up to a 40cm depth. Benchmarks are yet to be derived for upland grassland and semi-natural environments.
The soil health benchmarks also do not meet the requirements for assessing carbon stocks (t/ha), but they do provide an indication where SOM content is much lower than expected for the specific climate and soil texture combination. In these situations, farmers could change their practices by either reducing or minimising cultivations, maintaining crop residues, or adding or increasing organic inputs. This will increase the soil’s potential to store more carbon. NRM’s CarbonCheck service quantifies soil carbon stocks and can help confirm the benchmarking system.
Role of topsoil texture & climatic conditions on soil organic matter
The benchmarks group soil texture into three soil categories: light, medium, and heavy. RB209, the nutrient management guidelines, broadly describe which topsoil texture falls into which category. The table below is published in RB209 and should be referred to for additional guidance.
| Soil category | Soil types within categories | Properties |
|---|---|---|
| Light sand soils | Sand, loamy sand, sand loam to 40cm over sand or loamy sand or over sandstone. | Poor water holding capacity & retain little nitrogen. |
| Shallow soils | Soils with impermeable subsoils or over limestone, chalk, or other rock within 40cm of the soil surface. Sandy soil over sandstone is categorised as light. | Less able to retain nitrogen at depth. |
| Medium soils | Sandy loam over clay loam, silty or clayey topsoil over sandy or loamy subsoils. | Moderate ability to retain nitrogen and average rooting depth. |
| Deep clayey soils | Sandy clay loam, silty clay loam, clay loam, sandy clay, silty clay, clay over clay subsoil. These soils usually require field drainage. | Retain more nitrogen than lighter soil textures. |
| Deep silty soils | Sandy silt loam, silt loam, silty clay loam textures to 100cm. Silty clays of low fertility should be categorised as a medium soil. | Retain more nitrogen than lighter soil textures and allow deeper rooting. |
| Organic soils | Soils between 10-20% SOM to depth. | Retain more nitrogen than lighter soils and have increased nitrogen mineralisation potential. |
| Peat soils | Soils that contain more than 20% SOM. | Very high nitrogen mineralisation potential. |
Climatic conditions, particularly rainfall, interact with soil clay content and influence SOM content levels. The benchmarks reference this interaction by categorising three annual rainfall (mm) levels against each topsoil texture group.
The annual rainfall categories, described in the table below, are broadly split by geographical region.
| Category | Area rainfall (mm) | Area guide |
|---|---|---|
| Low | <650 | E England |
| Mid | 650-800 | Midlands, NE and S England |
| High | 800-1100 | SW, NW England and Wales |
The rainfall categories were determined in a previous DEFRA funded project. To read more about the rainfall categories for the SOM benchmarks, click here.
NRM is very keen to hear how our customers get on using the new benchmarking guidance and how they have used the interpretation in practice. Contact NRM to provide feedback on the new report.
If you need help in choosing the appropriate analysis for assessing SOM or soil organic carbon (SOC), contact NRM. Alternatively, speak to agronomist/advisor for help with the use of these benchmarks.
References
Soil Biology and Soil Health Partnership | AHDB
AHDB Soil health scorecard protocol and benchmarking – England and Wales (v1.0).pdf (windows.net)
AHDB Soil health scorecard protocol and benchmarking – Scotland (v1.0).pdf (windows.net)
Great news for GREATsoils: AHDB issues Soil Health Scorecard guidance | AHDB
Measuring and Managing Soil Organic Matter | AHDB
The Nutrient Management Guide (RB209).
To develop a robust indicator of soil organic matter status – DEFRA project SP0310.
Visit NRM