


Soil mineral nitrogen: what we’ve learned so far

NRM
Agriculture
Fertiliser prices began to soar in the autumn of 2021. As nitrogen prices reached £2/kg, the advice by ADAS was and continues to be to reduce applied nitrogen by 70kg N/ha. This is to account for the economic change to the optimal amount required by arable crops.
With these high fertiliser prices continuing to affect farming businesses everywhere, growers have been turning to analysis to optimise their crop nutrition programmes. NRM’s N-Check service, launched this year, has proved invaluable in assessing the soil supply of nitrogen to check how much more needs to be applied.
Read on to discover the importance of measuring soil mineral nitrogen (SMN), what our N-Check service is, and what analysis has told us so far.
The importance of measuring SMN
Nothing drives efficiency like the rising cost of production. The easiest way to mitigate against increasing prices is by fully accounting for the nitrogen supply available free from the soil. Theoretically, this means that crops shouldn’t be undersupplied because the soil always provides a proportion of what they need. However, determining how much extra from the bag is economic to apply for the predicted yield is more important than ever this season.
The co-benefit of fertiliser prices pushing farmers to lessen nitrogen inputs is the reduced pressure on the local and wider environment. There is much scope for the improved use of nitrogen in crop production, and all too often yield isn’t affected by reductions in applied nitrogen fertiliser. The trick is to understand how much to reduce inputs by. The simplest and most effective approach is to measure SMN and adapt nitrogen rates accordingly.
It is important to note that very large, measured soil nitrogen supplies need to be interpreted with care to ensure that productivity isn’t compromised. Generally, it is not advised to apply zero bagged nitrogen. The best approach in these high-level circumstances is to reduce the total amount typically applied by 25 to 50% and closely monitor the crop during the spring. Another proven way of gauging high soil nitrogen supply is to leave a representative area or tramline unfertilised. Yield maps at harvest will quickly indicate if the unfertilised crop was undersupplied.
Soil moisture and temperature are key to soil nitrogen recovery by the plant. If moisture is reduced, then plant available nitrogen will also be reduced. At this point, there wouldn’t be much we could do agronomically other than making sure soil structure and quality is the best it could be. Cold spring soil temperatures will also affect the rate of mineralisation, but generally what is estimated to become available will do so during the growing season, just later.
What is N-Check and what conditions have we been working with?
NRM’s N-Check service encourages sampling for SMN supplies down to 90cm in 30 cm soil depths or to the rooting depth of the crop. N-Check Plus also includes an estimate of mineralised organic nitrogen and reports the total soil nitrogen supply (SNS) value and equivalent RB209 SNS index if a spring crop nitrogen estimate was taken.
The autumn of 2021 was relatively dry, and warmer soil temperatures persisted to levels where mineralisation continued up until the cold spell in late November. Established ground cover over autumn would have taken up a proportion of any nitrogen released during this period. Since the turn of the year, weather conditions have been generally dry and cold. Lower soil temperatures minimise mineralisation and reduce the amount of nitrogen at risk of potential leaching. However, weather tends to be very localised, and measurement is a good way to determine how conditions have affected SMN levels across your farm or area.
What has analysis told us so far?
We have received 596 samples for soil nitrogen analysis in January so far, up over 50% on the same period last year. The values make for interesting reading.

As you can see, proportionately more SMN samples measured were between 15 and 30kg N/ha within each soil depth compared with other categories. In 2021 the majority of samples measured 0-15kg N/ha. The lowest SMN value measured so far was 1.3kg N/ha in the 30-60cm soil depth, while the greatest was 264kg N/ha in the same depth.
At each soil depth, SMN levels seem low on average. However, these numbers do not include the estimate of organic nitrogen due to be mineralised between now and harvest or the amount of nitrogen an autumn sown crop would have already taken up.
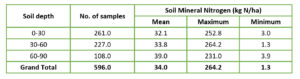
While the average SMN value was 34kg N/ha across the three sample depths, this increased as the sampling depth increased. 17% of the samples with greater than 60kg N/ha were at the deepest depth of 60-90cm. This was twice as many samples as at the shallower depths. This could suggest that nitrogen has leached further down the soil profile and may contribute to decision making around how much and how early nitrogen fertiliser should be applied this spring.
The largest SMN values could be a result of either:
- Genuinely high SMN reserves
- Inadvertent contamination when taking and preparing the sample for despatch to the lab
- Delay in getting samples to the lab and not keeping the samples fridge cold at all times. The warmer temperature causes an increase in SMN levels, inflating the results.
It is important to test your soils for SMN annually and benchmark levels across soil types and the cropping rotation. This will help inform your spring nutrient management plan and enable improvements in nitrogen use efficiency.
Our N-Check service reports information to help you adapt your fertiliser requirements depending on the seasonal nitrogen supply from the soil. This will help you save money amid volatile fertiliser prices, become more efficient, provide value-added insight to your management plans, and reduce the risk of excess nitrogen escaping into the environment.
Contact the team today to request sample kit and book your samples in.
Visit NRM