



Key findings from our 2022-2023 soil summary: arable vs grassland soils

NRM
Agriculture
Testing soils for pH, phosphorus, potassium, and magnesium levels helps to determine the nutrient content of the soil. By understanding these levels, growers can adjust management plans and apply fertilisers more efficiently, ensuring that crops receive the nutrients required for optimal growth. This also prevents over-application, which can lead to nutrient leaching, runoff and pollution of surface and groundwater, and under-application, which can result in a decrease in crop yields.
As the UK’s leading provider of soil analysis, NRM has been gathering soil analysis data since 1995. Every year, we publish the results from key soil health indicators based on soil chemical properties to show a broad picture of the major soil nutrients.
This year’s soil summary includes data from over 590,000 samples collected between June 2022 and May 2023 from four different crop categories. Instead of using mean values, we have used median values as medians provide better central tendency compared to means for this dataset.
This data should help farmers and their advisors not only understand the national soil picture for benchmarking. It will also help understand soil status both regionally and at county resolution so that farm soil health and crop productivity can be optimised.
In this blog, I will cover key findings from the soil summary in greater detail, including a review of the key nutrients including pH, and a comparison of nutrients measured in arable and grassland soils.
How did arable and grassland soils differ in soil pH?
Soil pH is one of the most important soil chemical characteristics because it influences the availability of major and trace elements and can impact soil structure. The pH scale is logarithmic, where each whole number change represents a tenfold difference in acidity or alkalinity. For example, soil with a pH of 4.5 is ten times more acidic than soil with a pH of 5.5, and a hundred times more acidic than a pH of 6. So, small changes in soil pH can have a massive effect on nutrient availability.
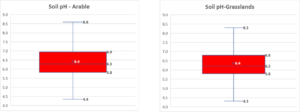
Upon exclusion of the outliers from the dataset, it’s apparent that the difference between grass and arable fields was not substantial. Both types of soils exhibited a similar pH range, but samples from arable fields showed a slightly wider pH range (4.2) compared to those from grassland fields (4.0), as illustrated in the accompanying figure below.
The results showed that nearly a third of the grassland samples analysed were well below the optimum soil pH of 6.2 recommended for mineral soils. In arable soils, this situation was even worse, as more than half of all the samples were below the optimum soil pH of 6.7.
Repeated applications of organic materials such as slurry and nitrogen and sulphur-based fertilisers have been shown to significantly decrease soil pH. Therefore, it is imperative to regularly monitor soil pH levels and take corrective liming measures to improve nutrient availability and optimise crop performance. For more detailed information on suitable materials and techniques for improving soil pH, refer to AHDB’s Nutrient Management Guide (RB209).
How did arable and grassland soils differ in soil phosphorus (P) levels?
Sufficient soil phosphorus (P) levels are essential for healthy plant growth and development. Its importance is due to it being a component of many plant processes such as rooting and plant establishment, seed and fruit production, and enhanced stress resilience.
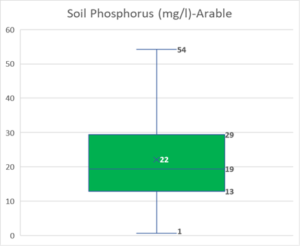
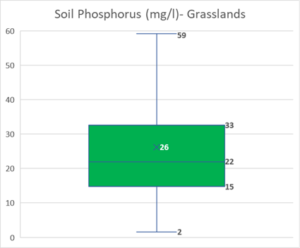
Whilst maintaining sufficient P levels in the soil is important for sustaining agricultural productivity, excess P in the soil can put the environment at risk. Our analysis of the data concluded that grassland soils had in total a higher available P, with a median value of 22 mg/l (top of index 2), compared to a median value of 19 mg/l (middle of index 2) measured in arable soils. The median values are shown as a horizontal line on the graphs. The figures below also show that the ‘mean’ P value in arable soils tends to be at the top of index 2 (22 mg/l), whilst for grassland soils the mean is at the bottom of index 3 (26 mg/l). We believe that the median is a better statistic to apply to this dataset because of its high variability.
It’s not surprising to see a higher median and P range in grassland soils. In most grassland systems, more organic inputs are applied compared to arable rotations. This year’s data supports this notion. Nearly 40% of grassland samples were higher than P index 2, compared to 36% of arable samples. To reduce the risk of building soil P, it is recommended to analyse the nutrient content of organic material before application. Farmers and advisors can also improve nutrient management by measuring crop offtakes in fresh materials and/or grains.
In both arable and grassland systems, it is important to regularly monitor soil P levels. High rates of P applied as manure and slurry can pose a risk to the environment, particularly after heavy rainfall, where there isn’t a crop need, or when applied to steep-sided fields (≥12ᵒ). To utilise P more efficiently, applications should be targeted when the crop has started growing actively. So, applying P to grassland soils ahead of early crop growth in spring can be beneficial as it can lead to a crop response.
Are soil potassium (K) levels falling in arable soils?
Potassium enables the movement of water, nutrients, and carbohydrates within plant tissues and is essential in activating the enzymes involved in the production of proteins and starch. It also has a function in the biochemical pathway that provides the plant with energy and plays an important role in the process of transpiration, regulating the amount of water lost by the crop. This controls the exchange of gases (oxygen and carbon dioxide) that drives respiration and photosynthesis. A poor soil K supply impacts crop growth: plants become stunted, nitrogen uptake is decreased, and yield potential is significantly reduced.
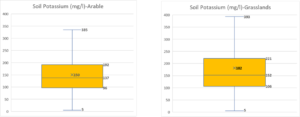
The data analysis of K levels in soils showed a similar trend to soil P. In grassland soils, a median K value of 152 mg/l (middle index 2) was measured, which was higher than the median value in arable soils (137 mg/l bottom index 2), indicated by the horizontal line on the graphs. The arable soils were at the bottom of K index 2- whilst grassland soils were at the middle of K index 2-.
However, if we compare the ‘mean’ K value from arable and grassland soils, the picture changes. Grassland soils had a mean K value of 182 mg/l (index 2+), compared to arable soils where the mean K value was 152 mg/l (index 2-). For this dataset with large variability, the median statistic provides a much better reflection of soil K status.
Digging deeper into the analysis shows an alarming situation. Nearly 37% of arable soils and a third of grassland soils were below the recommended K index of 2- in 2022-2023. Potash offtake from arable soils can be large, particularly if residues are being removed from the fields and not replaced through inputs.
Farmers and advisors should monitor their soil K levels regularly and adjust the levels through organic and inorganic inputs. If it’s difficult to obtain organic inputs locally, then you can manage residues more effectively within the rotation by not always removing straw, or by growing over winter cover crops to help retain nutrients.
How did arable and grassland soils differ in soil magnesium (Mg) levels?
Magnesium plays an essential role in plant biochemical processes. It is involved in chlorophyll formation, which is essential for photosynthesis and enzyme activation. Photosynthesis, protein synthesis, and energy transfer rely on a good supply of soil magnesium.
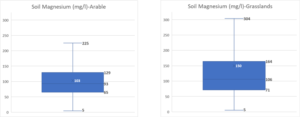
Amongst the macronutrients analysed by NRM, the biggest variance was found in Mg in both arable and grassland samples. The median for grassland soils was 106 mg/l (index 3), whilst it was 93 mg/l (index 2) for arable soils. However, if looking at the mean values presented as an ‘X’ in the figures below, both arable and grass soils were index 3.
Soil Mg deficiency in combination with high soil K levels can be a bigger problem than high soil magnesium as it can cause animal health issues in livestock-based systems. A lack of Mg in herbage, fed or grazed by animals, can cause hypomagnesemia (staggers) which can be very serious. It is recommended to keep Mg herbage levels ≥0.2%. Organic amendments and application of fertilisers can be used to improve the soil Mg levels.
How NRM can help
NRM’s standard soil analysis package (pH, P, K, Mg) provides soil concentration levels, which are then applied to the RB209 index system for easy interpretation. Combining soil analysis data with other analyses, such as soil organic matter, soil carbon, and soil mineral nitrogen, provides farm businesses with vital information that can support the management decisions needed to optimise crop yields and build in soil resilience.
Read our recently published soil summary here.
For a quote on any of our services or for more information, contact us today.
Want to be notified whenever we publish a new blog?
Give us your email address and click submit to sign up for notifications once a month.