



Grain analysis: trace mineral data for winter wheat

NRM
Agriculture
In our previous blog, we discussed how NRM is leading the way in establishing better grain-critical nutrient values for wheat and other crop species. Today, we are continuing to share our grain analysis results, this time focussing on the uncertain or unknown trace mineral data concentrations of wheat grain.
Many farmers routinely treat crops with trace minerals, also known as micronutrients. Using grain analysis to understand if the treatment enhanced trace mineral concentrations can indicate whether this method succeeded or not.
However, the financial implications of ineffective management decisions can be significant, so having a reliable benchmark for comparison is crucial. This is where NRM’s commitment to providing the best data for effective management decisions becomes vital. Whilst undertaking analysis often involve some initial costs and investments, no-one wants to apply unnecessary products or make management changes based on speculation, so having insightful, robust data is one of the best tools at your disposal.
Trace mineral data assessment of wheat grain: Rothamsted Research
A 2012 research project funded by AHDB and conducted by Rothamsted Research highlighted the intriguing complexity of trace mineral yield responses in wheat crops. They performed 15 experiments over three years and concluded that detecting a real significant yield benefit from the application of trace minerals, in this case, manganese (Mn), copper (Cu) and zinc (Zn), was problematic. Of the fifteen wheat experiments, only two statistically significant yield differences were detected: one for Cu on a light loamy sand; and one for Zn on a high calcareous soil where treatment applications were made.
The sites where the trials were located had characteristics that resulted in low trace mineral soil content or low plant availability due to a high pH (calcareous soils), light and sandy soil texture, or soils high in organic matter content. One significant outcome of the study was that the experiments’ design, the laboratory analysis methods, and the agronomic and climatic interactions all influenced how well trace mineral yield responses were detected.
This study highlighted the complex interactions of trace mineral nutrition in identifying true crop deficiencies, which, when treated, resulted in an economic yield response. The study also underscored the need for further research and understanding in this field. It examined how minerals are measured in the soil and the plant tissue and found that most analytical approaches have positives and negatives. Using them to predict crop deficiencies wasn’t always consistent, underscoring the challenges in trace mineral data nutrition and the need for further research and understanding.
Grain analysis was essential in the trials to determine the nutrient concentration in harvested grain. It involved measuring Cu, Mn, and Zn concentrations in all grain samples.
A single critical value or an optimal range?
In summary, the grain analysis showed that not all concentrations reflected in the grain matched the earlier diagnosis of the crop being either sufficient or deficient. The grain critical values applied in the study were determined from previous studies, and depending on which grain critical value was applied, an inadequate or sufficient supply could be concluded. This is an essential aspect of the study because it suggests that critical values should probably be applied as a range rather than having to meet a single-grain concentration value.
Trace mineral data: wheat grain analysis results
As the UK’s leading provider of agronomic analysis to the land-based industries, NRM has several thousand grain samples from the past three harvests to help establish better critical value ranges for trace minerals with greater certainty. This process involves rigorous statistical analysis and comparison with existing literature. Some critical values for elements, such as Boron (B), Calcium (Ca), Iron (Fe) and Molybdenum (Mo), are currently unknown, but NRM is in a position to begin to determine what those critical value ranges might be for harvested grains of winter wheat.
As we analyse how the grain data is distributed within the dataset, we can understand the statistical distribution of the results and identify where the critical values may be located. By categorising the nutrient data into the median, 25th and 75th percentiles, as well as the minimum, maximum, and outlier values, we can gain insight into the nutrients that may fall into the lower quartile of results. This trend could suggest that crops unable to reach the lower threshold value may have experienced a lack of supply or availability during the season, as shown in Figure 1.
As concluded in the study above, it’s more than likely that there isn’t one absolute critical value that must be reached to ensure that yield and quality are achieved. This is because these values can be different depending on the weather during the crop and grain development, and can also vary due to higher or lower crop yields. Instead, it’s more likely that a critical value range needs to be determined, and reviewing the data in this way will allow NRM to estimate what those critical value ranges might be.
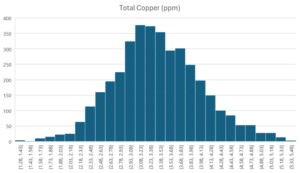
For instance, Figure 1 below shows the amount of copper in winter wheat ranging from 1.7 to 5.2 ppm with a median value of 3.4 ppm. In this case, the sufficiency range (optimal amount of crop nutrients) is considered to be 3.0 to 3.9 ppm which is also between the first and the third quartile of the data. Our data in Table 1 suggests that nearly 53% of the samples analysed were present in the sufficiency range this can also be observed in Figure 2 showing the frequency distribution of grain copper content in winter wheat.
Figure 1. Grain analysis for copper in winter wheat (ppm)
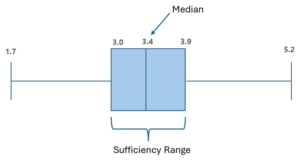
Figure 2. Frequency distribution of grain total copper in winter wheat
The table below shows the statistical analysis of the data from grain samples received between 2021 and 2023. The data indicates that the majority of the samples were in the ‘threshold range’.
Table 1. Critical range of grain nutrients in winter wheat
| Nutrient | Trend in Critical Value Range | |||
| Minimum | Maximum | Median | Samples within the threshold range (%) | |
| Boron (ppm) | 0.24 | 1.28 | 0.76 | 61 |
| Calcium (%) | 0.02 | 0.058 | 0.037 | 52 |
| Copper (ppm) | 1.7 | 5.2 | 3.4 | 53 |
| Iron (ppm) | 16 | 48 | 32 | 50 |
Trace mineral data: how can we use crop sensitivity to optimise trace mineral nutrition?
Different crops have varying sensitivities to trace mineral supply, and other growing environments, climatic influences, and agronomic management also dictate how poor or rich the nutrient supply might be. We can create a perfect storm by growing known sensitive crops in situations of sub-optimal supply due to low soil organic matter content, sub-optimal pH, poor seedbed consolidation, and soil moisture conservation.
For example, we know that wheat is typically sensitive to a low supply of manganese and copper. The supply of some trace elements UK is usually not a problem, and we can plan to consolidate the seedbed and preserve soil moisture to help alleviate manganese deficiency. Livestock manure and other organic inputs are rich in most trace minerals and are good at building soil organic matter, the engine behind many beneficial soil functions.
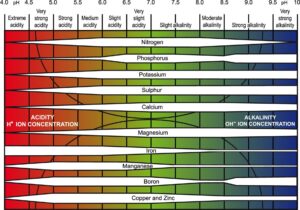
Finally, soil pH significantly influences the plant availability of trace minerals at both ends of the pH scale. Nutrients are locked up by the soil chemistry, reducing plant availability. The cheapest take-home message is to routinely check your soil pH and be prepared to lime if it slips below the optimal pH for the crop, which is 6.5 for wheat and other cereals. At the other end of the pH spectrum, where it is naturally high, treating sensitive crops with trace minerals to avoid the risk of low supply may be justified. Another option is avoiding growing susceptible crops.
As a reminder, the chart below describes how soil pH affects the availability of major and trace minerals.
How NRM can help
To learn more about grain analysis and our GrainCheck services, click here. You can also contact your local advisor to learn more about the benefits of grain analysis or book in your tests.