


Gearing up for grain analysis: insights from previous cereal grain harvests

NRM
Agriculture
It’s time for farmers to rev up their combine harvesters and reap the rewards of their hard work over the last year. If that’s you, you should also be thinking about getting your grain samples ready to send to the lab to determine how this year’s harvested crops can help us understand the needs of future crops.
Crop grain data can provide vital information about how well the crop growing season went. This includes how effectively the crop acquired nutrients from the soil and allocated them to the grains, affecting quality and yield. You, alongside your advisors, can then use these insights to adjust management plans for the next season for optimal productivity.
A. GrainCheck results from 2021 and 2022
In 2019, AHDB funded a research review to improve understanding of nutrient management using grain analysis. The review found that the recommendations in RB209 were too high and proposed to reduce the grain offtake from 7.8 to 6.5 kg P2O5/t for winter wheat.
The research review also demonstrated that the nutrient content of the grain is a good indicator of how efficiently the crop has utilised the available nutrients in the soil.
As a result of these findings, NRM launched its GrainCheck service in 2021 to help farmers and advisers optimise their nutrient management by testing cereal grains. As the largest provider of agronomic analysis for land-based industries in the UK, we are in a unique position to deliver expert advice to help growers improve farm productivity.
The following data is derived from around 5,000 wheat grain samples from the 2021 and 2022 harvests.
- Grain nitrogen and phosphorus content
Nitrogen and phosphorus are significant yield-limiting nutrients in crop production. Deficiency of these nutrients can lead to serious yield losses, whilst excessive application of these nutrients can result in losses to the environment. This can cause ecosystem degradation.
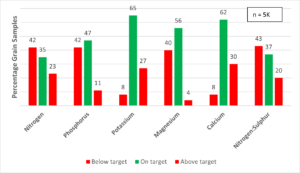
- Our results in Figure 1 below show that 42% of the samples analysed were below the threshold target range for both nitrogen (1.9-2.1%) and phosphorus (0.28-0.32%).
- Nearly a third of samples were within the target range for nitrogen, whereas almost half were within the target range for phosphorus.
- A quarter of samples exceeded the target range for grain nitrogen. However, the results showed that only 10% of samples were higher than the target range for phosphorus.
In order to improve the uptake and utilisation efficiency of key nutrients such as nitrogen, phosphorus and potassium, we recommend that the soil is regularly tested and plant tissues are analysed. This is especially important in crops where deficiency symptoms are apparent.
Soil pH plays a very important role in the availability and uptake of all nutrients. Maintaining an optimal pH according to the type of soil and the rotation can significantly improve the availability of nutrients utilised by the crop.
Figure 1: Percentage of nutrients measured in wheat grain (2021 and 2022 harvests)
- Grain potassium, magnesium, and calcium
Similar trends in grain potassium, magnesium and calcium were observed.
- Nearly 40% of samples were deficient in magnesium, whilst only 8% were deficient in potassium and calcium.
- The results also showed that most samples were well within the target range: 65%, 56% and 62% for potassium, magnesium, and calcium respectively.
- Just above a quarter of samples analysed for grain potassium and calcium were higher than the target range, compared to only 4% of the samples for magnesium (figure 1).
Our GrainCheck results suggest that magnesium deficiency is more widespread than previously thought. This is also supported by soil test results. Magnesium deficiency is most likely to be found on lighter more sandy soils which have a low cation exchange capacity, especially where the latter is dominated by other cations due to extreme soil pH. It is also suggested that soils with a high K:Mg ratio are more likely to induce magnesium deficiency as opposed to soils which have a high Ca:Mg ratio. If the soil is deficient in magnesium, we recommend applying 50-100 kg every 3-4 years.
- Nitrogen and sulphur ratio
Since the clean air act was introduced in the 1950s, sulphur dioxide emissions from heavy industry have significantly reduced. This has inadvertently led to sulphur deficiency being seen in many crops and it affects the quality of wheat crops grown for bread making.
The grain N:S ratio is a good indicator of how well the crop was able to capture and utilise both nitrogen and sulphur. These are essential elements required for protein formation in cereal grains.
- Nearly a fifth of samples were above the target range of 17:1. This means that the crops may have suffered from sulphur deficiency.
Nitrogen and sulphur work hand in hand. A lack of nitrogen and/or sulphur can reduce the utilisation efficiency of both nutrients, resulting in poor plant growth and yield.
Nitrogen and sulphur are water soluble and behave the same when in and applied to the soil. Both can easily leach away if plants are unable to use these nutrients or if more is applied than the crop requires. Therefore, it is crucial that soil nitrogen is annually tested and both nitrogen and sulphur are regularly monitored in crop tissue during the spring. Analysis determines their adequacy within the crop and how much the soil can supply. Crop utilisation can be improved if these nutrients are applied via a ‘little-and-often’ approach.
To determine sulphur deficiency, RB209 recommends the malate:sulphate test. This is the determination of malate to sulphate concentration in the youngest leaves, and a ratio of >1.5:1 confirms if a cereal crop is deficient. It is critical to sample crops when they are actively growing and over a two-week period to determine either a permanent or transient deficiency (which occurs due to rapid growth) exists. Recent AHDB trials have indicated that applying 50kg of sulphate/ha in milling wheat crops can reduce the risk of acrylamide forming in baked products and reduces the symptoms of sulphur deficiency in the growing crop.
- Micronutrients in cereal grains
GrainCheck also includes micronutrient analysis for cereal grains. It’s argued that the micronutrient deficiency in cropping systems may have increased due to fertility depletion through intensive cultivation of high-yielding varieties, as well as limited use of animal manures.
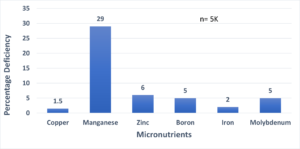
Our results from the last two harvests show that only around 1.5% of samples were deficient in copper, whilst 6% were deficient in zinc. Manganese deficiency seems to be quite widespread, with nearly a third of samples showing a deficit (figure 2).
Manganese deficiency is acknowledged to be the most widespread micronutrient problem in arable crops in the UK and is more common in oats than in wheat and barley. Winter cereals have a better root structure than spring cereals, so deficiency is more likely to be seen in spring-sown crops. Tissue testing is the best way to diagnose manganese deficiency, which can then be corrected by foliar application. It’s also recommended to apply manganese to soils with pH >7.8.
We don’t currently have threshold values for boron, iron, or molybdenum. Data analysis has shown that grain samples below 0.6mg/kg could indicate a deficiency for boron, but it is not advisable to just use a grain test to determine its deficiency, as only very small quantities are present in cereal grains. Instead, deficiency can be determined using soil analysis, indicated by a value of less than 0.8 mg/kg. Tissue tests can also be useful to determine boron deficiency.
Similarly, we don’t have a threshold value for iron. There is an abundance of iron in most soil in the UK due to soil type, but heavy metal toxicity, due to excessive soil contamination, can restrict plant iron uptake. Samples containing less than 25mg/kg could be considered deficient in iron, which accounts for about 2% of our results from the last two harvests.
Molybdenum analysis is available through GrainCheck Plus. Deficiency in cereals grown in the UK is not common, but if you choose to apply nitrate-only fertiliser, you need to be sure your crops are getting enough molybdenum. Light acidic soils with a pH of around 5.5 or below could also trigger molybdenum deficiency. Our data suggest that around 5% of 1,500 grain samples were below the threshold value of 0.15 mg/kg.
Figure 2: Micronutrient deficiency in wheat grains (%)
B. How do these results compare with the book value (RB209)?
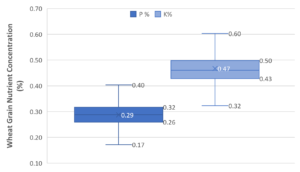
Our results in figure 3 below show that the median value (0.29%) for grain phosphorus was lower than the recommended threshold value (0.32%) in RB209. Typically, a winter wheat crop with an average yield of 8t/ha would remove 5kg/ha less P2O5 than the current RB209 recommendations suggest. Figure 3 shows that around 75% of the samples were at or below the threshold value of 0.32% grain phosphorus. This suggests that the threshold value of 0.32% in RB209 may be too high.
The median value for grain potassium was 0.47%, which is nearly 20% higher than the critical value suggested by the ADAS Yield Enhancement Network (YEN). So, once again, standard offtake values for potassium could be significantly higher than currently thought. According to our calculations, an average 8t/ha winter wheat crop would remove an additional 9kg/ha K2O compared to the critical value.
For both phosphate and potash, these new findings need to be corroborated with industry and more data added to the analysis to validate the results before recommendations can be adjusted.
Figure 3: Grain phosphorus concentration in winter wheat for the 2021 and 2022 harvests
C. How did the grain nutrient concentration vary between harvest years 2021 and 2022?
We reviewed the grain analysis data on an annual basis to see if there was any effect of weather conditions on the major nutrients (nitrogen, phosphorus and potassium). Our results showed that there was a significant difference between the nutrients during the two years.
- Wheat grain nitrogen concentration
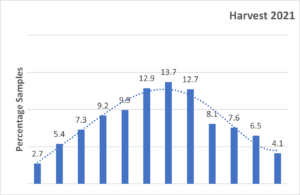
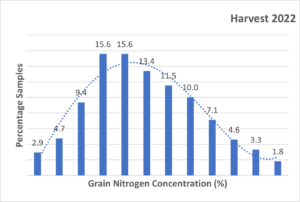
The normal distribution curve in figure 4 below shows that there was a significantly higher number of grain samples with lower nitrogen concentration during 2022 compared to the harvest in 2021. There could be multiple reasons for this, but 2022 was significantly dryer and hotter than 2021. These conditions during late spring and summer may have affected nitrogen uptake. Furthermore, wheat yields in 2022 were 9.9% higher than in 2021 (Defra Statistics, 2022), and higher yields tend to dilute grain nitrogen concentrations.
Depending on how crops develop, it is sensible to consider testing the soil and crop tissue during periods of active growth. This can help to calibrate how much nitrogen fertiliser needs to be applied. Nitrogen uptake can also be affected by the type/source of nitrogen fertiliser applied. For example, the efficiency of urea-based nitrogen fertilisers is reduced if applied to dry soil in warmer spring conditions.
Figure 4: Comparison between wheat grain nitrogen concentration in 2021 and 2022 harvests
- Wheat grain nitrogen concentration
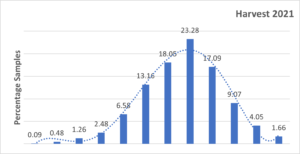
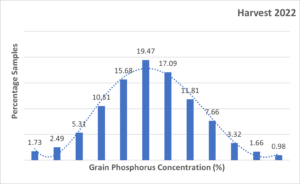
A similar trend was found in grain phosphorus concentration. As you can see in Figure 5 below, grain phosphorus concentration was much higher in 2021 compared to 2022. The 2022 results indicate that the dry soil conditions during the spring and summer may have led to lower grain phosphorus offtakes because lower soil moisture reduces the uptake of phosphorus resulting in lower concentrations in the grain at harvest..
Figure 5: Comparison between wheat grain phosphorus concentration in 2021 and 2022 harvests
- Wheat grain potassium concentration
In cereal crops, the uptake of potassium during the peak growth period is much higher than its final offtake at harvest. During the peak requirement period, if potassium is limited, grain filling can be affected and the number of grains/ear is reduced, impacting yield. At flowering, potassium is redistributed within the plant, moving from leaves to the grain and the stem base. Potassium is then also returned to the soil as the crop ripens.
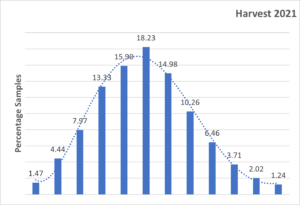
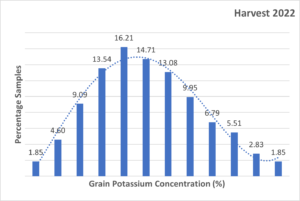
The results in Figure 6 below indicate that there was no apparent effect of season or weather conditions on grain potassium offtake. ADAS Research Review 92 asserted that total soil potassium supply isn’t always related to the total taken up. This is because the plant recovers far more than it needs, distributing a proportion to the grain and straw and the surplus going back into the soil. For example, if the weather is too dry at grain maturity, a higher concentration of potassium remains in the straw. Occasionally this is evident at harvest, as the straw has a distinct pink hue.
Figure 6: Comparison between wheat grain potassium concentration in 2021 and 2022 harvests
As grain contains most of the nutrients a crop takes up from the soil, farm decision-making can be more reliable if grain analysis is combined with soil and crop tissue analysis. Grain testing is a means of assessing nutrient offtakes and determines how well a crop has been supplied with its requirement. Any deficiencies or surpluses measured in the previous crop can be reviewed and supply corrected within the following crop. This analytical approach and the attention to detail it provides is the best way to reduce the cost of production, protect the environment, and manage land in a more sustainable way.
Our GrainCheck analysis package is suitable for a range of crops, including winter and spring cereals. The easy-to-use nutrient offtake calculator makes GrainCheck the most innovative grain analysis service available and provides evidence of how well you are managing nutrients.
NRM supplies everything you need to take your samples. Get in touch now at 01344 886338 to request a sample kit or speak to your agronomist to book our comprehensive GrainCheck service today.
References
Defra statistics 2022. https://www.gov.uk/government/statistics/cereal-and-oilseed-rape-production.
AHDB Nutrient Management Guide (RB209)
A review of the non-NPKS nutrient requirements of UK cereals and oilseed rape. AHDB Research Review No.78.
Offtake values for phosphate and potash in crop materials. AHDB Research Review N0.92
Potash for Cereals, Potash Development Association.
Visit NRM