


CropCheck 2023: where did we end up?

NRM
Agriculture
Seasonal and weather conditions define the rate of crop nutrient recovery. These impact yield overall, meaning that growers must observe their crops very carefully in periods of extreme or uncertain weather conditions to ensure they’re getting all they need to thrive. That’s where our innovative plant tissue service, CropCheck, comes in.
CropCheck allows growers to assess the plant as it develops so they can adjust nutrition decisions at key times in the season. What has the weather been like so far this year, and how has it affected our crops?
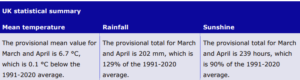
March and April have certainly been challenging. The cooler conditions have undoubtedly delayed the Spring, impacting on the speed of crop development.
Following on from the driest February in England in 30 years, March was one of the wettest across England and Wales and since records began in 1884. Overall, March was duller and cooler than average right across the UK. Temperatures did recover however across the second half of the month in the South of England. The colder temperatures and snow in Scotland during March, whilst annoying and disruptive, were fairly typical according to the Met Office.
The weather for April continued to be mixed and regionally quite variable. Temperatures fluctuated, but over the month they averaged out to be around normal. Rainfall also ended up being typical, but there were large regional variations, with most parts of Scotland being drier than average and eastern areas in England being rather wet, particularly Kent. Whilst the rainfall has been welcomed in many quarters after the very dry conditions last year and at the start of 2023, we should not get complacent with the use of water as many reservoirs are not yet back to capacity.
A silver lining over the last couple of months is that sunshine hours have perked up recently and were 102% of the average for April in the UK. This will help crops flourish as Spring temperatures increase across the country.
Met Summary for March and April 2023
Regional variations in temperature and rainfall that happened during the early part of the spring have influenced crop development. Now that soil and air temperatures have finally increased, crops start to make up for lost time and sail through the growth stages in quick succession. Locally to me in the northwest, a lot of wheat crops have already made it to GS37-39, but many are fairly short. However, this shouldn’t negatively influence grain yield if soil moisture and nutrition are adequate.
CropCheck 2023: where did we end up?
In my previous blogs, I described the nutrient content of crop tissue analysed over the past couple of seasons (2021-22 & 23 at GS30-31). So far, NRM has analysed about 500 plant tissue samples for CropCheck, and this high-level analysis has indicated how well crops have recovered nutrients by the critical growth stages, GS30-31 and GS32-37. For those that have read my previous blogs, it will be spot the difference between the seasons!
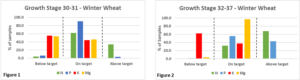
The following figures 1 and 2 show the proportion of winter wheat samples where the nutrient concentration is considered either below, above or within target for the growth stage.
Nitrogen
At GS30-31, the amount of nitrogen measured in the crop tissue was mostly on target, but 30% of samples were above target. Of the samples that fell within target, around half contained nitrogen levels that were at the upper end of the range. This suggests that most crops were over supplied with nitrogen at the earlier GS30-31. The trend persisted at the later stages, GS32-37. Most wheat crops (>60%) at GS32-37 contained above target concentrations of nitrogen. Half of the crops analysed were on target. These higher concentrations of nitrogen could increase the crops’ susceptibility to disease and crop lodging, potentially impacting on gross margins.
The best way to avoid over supply of nitrogen, which costs money and leads to excess soil nitrogen, is to measure soil nitrogen in late winter/early spring before any bagged fertiliser is applied.
Phosphorus
Nearly all samples analysed for phosphorus at GS30-31 fell within the target range, but 56% of the samples were at the upper end. A third of the samples within the target range had concentrations between 0.3 and 0.4%, the minimum needed for adequate growth. As crop growth progressed to GS32-37, the proportion of samples exceeding the target concentrations increased. This shift could be due to increased soil phosphorus mineralisation and subsequent plant availability as we moved through March into April.
The best approach to managing soil phosphorus is to maintain at target index 2. I would recommend aiming to match supply with crop removal. Building soil indices beyond necessary is an expensive hobby and can increase the risk of phosphorus escaping into the wider environment.
Potassium
The measured concentration of potassium at GS30-31 was largely below the target range. Approximately 40% of samples had concentrations which were within target, but all these fell at the lower end of the range. Very few samples were above the target range. This trend continued as crops progressed from GS30-31 to GS32-37.
This data indicates that the supply of potash to the crops analysed was sub-optimal, or that the seasonal conditions have impacted the crops’ opportunity to scavenge from within the system. Soils which are rich in magnesium or are acidic can reduce the crops’ ability to recover potash. Potash can also be leached from soil systems after persistent heavy rain or irrigation, particularly on light or chalky soils. The image below reminds us of what potash deficiency looks like in the crop.

Image of potash deficiency in winter wheat
Potash deficiency symptoms occur in old leaves. Chlorosis starts at the edge of the leaf margin, giving a scorched appearance. Symptoms in the field are hard to spot and yield can be affected even if symptoms aren’t on display in the crop. Backing up tissue analysis in the autumn with soil analysis is the best way of determining if potash deficiency is a supply, availability, or management issue. Understanding the available soil potash stock is the best way of managing its supply to the crop.
Magnesium
The magnesium levels measured at GS30-31 were largely split between the target range or below the target. Only 1% exceeded the target range. The trend shifted, however, as crops developed. At GS32-37, nearly all the crops analysed fell within the target range, but more than 50% were at the lower end of the target range. Seasonal stress factors will affect the ability of crops to recover magnesium even when soil supply is adequate. Cold wet periods, poor soil conditions and root development contribute to reduced magnesium crop availability.
The spring this year has certainly been challenging and therefore, building more resilience into soils should help. Improving soil structure to increase soil function will help nutrient cycling and availability.
Trace Minerals
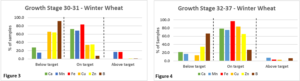
Figures 3 and 4 describe the proportion of samples that met the target concentrations for trace minerals, calcium, manganese, copper, iron, zinc and boron.
Copper (Cu), Zinc (Zn) and Boron (B)
At GS30-31, a larger proportion of samples contained below target Cu, Zn and B concentrations. In terms of B, the below target concentration persisted in samples measured between GS32-37. Wheat and cereals in general are not sensitive to B deficiency, but this could indicate an issue for a more sensitive following crop, such as oilseed rape. High pH soils, or leaching from soil caused by a wet winter/spring, can reduce the supply and availability of B.
By the time crops had reached GS32-37, the proportion of samples below target for Cu and Zn had reduced, and 80% of crops samples were on target for Cu and 60% on target for Zn.
Calcium (Ca), Manganese (Mn) and Iron (Fe)
At GS30-31, Ca, Mn and Fe were largely on target. However, nearly 20% of samples were above target for Fe and 28% were below target for Ca. Liming to maintain the pH of the soil generally ensures enough Ca for crop growth, but soils that are light and prone to leaching can lead to lower availability. At GS32-37, more crops contained target concentrations of Ca (80%), and the proportion of crops below target at GS30-31 was reduced by 5% at GS32-37.
Mn had nearly the same proportion of samples below and above the target concentrations, suggesting that only a minority of crops had an issue accessing enough for adequate growth. The proportion of samples above target for Mn at GS30-31 halved at GS32-37. Mn is one of the trace elements that is more commonly deficient in UK cereals, and nearly 20% of the samples at GS32-37 were below target.
Mn deficiencies occur in soils which contain high organic matter levels, have a high pH, or have been over limed. Soil management can also have an impact: poor seedbed consolidation at establishment can reduce a crop’s accessibility to Mn. Often plants growing next to tramlines or in wheelings will show normal growth due to the soil consolidating effect.
Deficiencies in Fe are rare in the UK. Nearly 20% of samples contained above target concentrations, suggesting that Fe availability and uptake hasn’t been an issue at either growth stage.
Overall, very few crops measured resulted in above target trace mineral concentration at GS32-37, which shows that the majority of crops were not over supplied with most of the secondary nutrients.
Be prepared for CropCheck next Spring
CropCheck, our innovative cereals plant tissue analysis package that links nutrient values to the growth stages that coincide with the fertiliser application window, is available for a broad range of cereal crops including winter and spring barley, winter and spring wheat, winter and spring oats, and rye. Growth stages range from GS30 to GS37. NRM provides a sample kit which contains everything needed to place an order for CropCheck analysis. This comes with an analysis request form, sample bags, sample posting envelope, and full instructions on how samples should be taken, prepared, and despatched to the laboratory.
Results are reported in an easy-to-understand visual format so nutrient adequacy can be determined quickly. Interpretation is also provided to guide why nutrient levels might be high or low. You can order your kit through your agronomist, or you can order here. Alternatively, contact NRM customer services on 01344 886 338 or at enquiries@nrm.uk.com.
References
Seasonal Forecast Assessment – March & April 2023 (Met Office)
mwr_2023_04_for_print.pdf (metoffice.gov.uk)
mwr_2023_04_for_print.pdf (metoffice.gov.uk)
Crop Nutrition Guide – The Crop Nutrition Directory
Visit NRM