


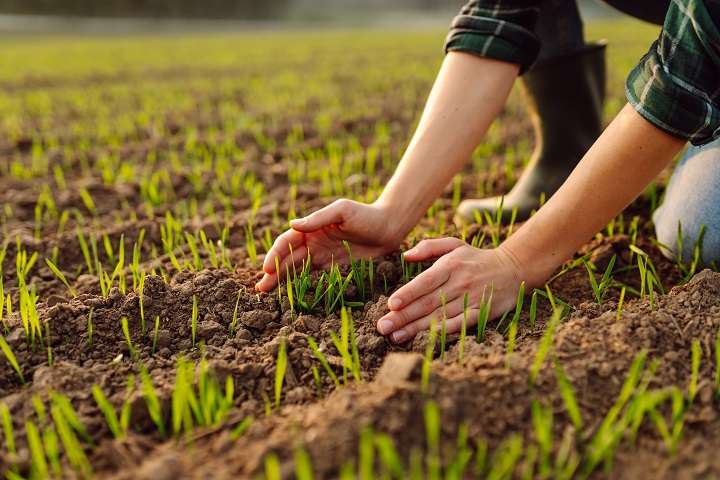
Beyond the index scale: NRM’s soil summary 2024-2025

NRM
Agriculture
Each year, experts at NRM scrutinise the soil analysis data (pH, phosphorus, potassium and magnesium) the lab received during the previous 12 months (June – May), and this year is no exception. Standard soil analysis provides some fascinating insights that help farmers maximise the benefits of applied nutrients and become more efficient. When aggregated on a national index scale, soil analysis reveals trends that can indicate how the industry is collectively managing land.
Click here to read NRM’s soil summary for 2024-2025.
This year, NRM has analysed the data more deeply than ever before, examining how the results are dispersed within the indices to understand the distribution of results that fall into the bottom, middle, or top segments of the index. Knowing this information is essential and should assist interpretation of the nutrient recommendations system (which is based on RB209’s index system), as well as the nutrient concentration measured.
Since the introduction of the Environmental Land Management (ELM) SFI schemes, soil organic matter (SOM) analysis has become a more routine part of testing. The way you manage the nutrient status of your soil directly influences the profitability of your business. With a focus on more sustainable nutrient management, external environmental costs can also be significantly minimised, helping the agricultural industry reduce its impact on the natural systems it depends upon. So, this year, NRM has incorporated SOM into its national-scale analysis.

The index scale and how it relates to the measured results
When farmers receive soil test results, many focus solely on the index scale value. While it is essential to know the index to determine the appropriate recommendations for the crop to be grown, farmers can optimise inputs more effectively by also considering the nutrient concentration. This concentration is typically expressed in milligrams per litre or parts per million, which are equivalent measures.
The table below serves as a reminder of the concentration ranges for each nutrient index.
Table 1 – Classification of soil analysis results into indices – AHDB Nutrient Management Guide
| Index | Phosphorus (P) | Potassium (K) | Magnesium (Mg) |
| milligrams/Litre (mg/l) | |||
| 0 | 0-9 | 0-60 | 0-25 |
| 1 | 10-15 | 61-120 | 26-50 |
| 2 | 16-25 | 121-180 (2-)
181-240 (2+) |
51-100 |
| 3 | 26-45 | 241-400 | 101-175 |
| 4 | 46-70 | 401-600 | 176-250 |
| 5 | 71-100 | 601-900 | 251-350 |
| 6 | 101-140 | 901-1500 | 351-600 |
| 7 | 141-200 | 1501-2400 | 601-1000 |
| 8 | 201-280 | 2401-3600 | 1001-1500 |
| 9 | >280 | >3600 | >1500 |
For arable and managed grassland crops, the objective is to maintain the index at 2 for both phosphorus (P) and magnesium (Mg), and 2- for potassium (K), aiming for concentrations towards the middle of the index scale.
It is essential to understand your results in the context of where they fall within the index scale because crop recommendations are based on concentrations found in the middle range of each index. This is especially crucial for index 2, where the goal is to replace the nutrients that the crop removes with appropriate inputs.
The NRM team has selected three of the big arable regions to analyse: the Southwest, and the East and Southeast of England combined. We analysed the results from fields growing either a cereal or where grassland was managed for either silage (1, 2 or more cuts) or for grazing.
Interestingly, we found distributions that you might not expect. Where grassland was managed for both cutting and grazing, a greater proportion of samples were measured at the bottom, phosphorus index 2, and fewer samples were measured at the top of the index. For cereals, nearly an equal split within the phosphorus index was observed.
Table 2 – The percentage of soil phosphorus concentrations at the bottom, middle or top of index scale 2
| Key | Crop | Soil phosphorus – index 2 | ||
| Bottom | Middle | Top | ||
| Greater | 1Grazing | 43 | 33 | 24 |
| Fewer | 1Silage | 43 | 33 | 24 |
| Target | 2Cereals | 33 | 38 | 29 |
| 1soil analysis data from the Southwest of England. Silage sample description (1 or multiple cuts). Grazing circumstance/frequency unknown. | ||||
| 2 soil analysis data from the East and Southeast of England. All cereal types included, straw baled | ||||
What might this mean for phosphorus inputs? Phosphorus is an essential input for healthy crop growth, but when in excess, it can very quickly threaten water quality and natural systems. In these data, however, a greater proportion of the soils analysed are being maintained toward the bottom of the index, which reduces the risk to the environment but could also result in lower yields. More frequent monitoring is necessary to ensure that soil phosphorus supply doesn’t slip into index 1 or below.
For example, the phosphorus recommendation at index 2 for grazed grass is 20kg, 40kg for first cut silage, and 55kg P2O5/ha for winter wheat. If you are currently at the lower end of index 2 but want to improve your index towards the middle, you should increase the amount of phosphorus inputs you apply. This increase should be based on the amount being removed by the crop. Building soil indices, especially from a low starting point, requires a long-term perspective and can be costly, depending on how quickly you aim to raise the index.
Working at the bottom of index 2 doesn’t need to be problematic, and many farmers are taking this approach to manage costs and minimise risks to the environment. However, there are a few rules which are advisable to follow, regardless of the nutrient in question:
- Increase the frequency of soil sampling: rather than every four or five years, consider analysing every two or three years.
- Understand how much is being removed by the crop and ensure that you replace what is removed.
- Improve and maintain soil health: increase SOM levels, optimise soil structure, and introduce more below (rooting) and above-ground (canopy) diversity into your crop rotations.
- Consider in-season analysis to ensure the crop is recovering enough from the soil and that inputs are sufficient for healthy growth.
- Be prepared to invest more in fertiliser or organic inputs to boost the soil index if it begins to decline.
If your soil test results indicate that you are at the upper end of index 2, it’s advisable to reduce your fertiliser inputs to prevent further increases in soil phosphorus concentration. Managing soil at the upper end or above index 2 poses a higher risk to the environment. Therefore, it is wise to save money and refrain from applying inputs to fields in this category unless there is a clear agronomic need.
The following table describes the percentage of potassium results measured at the bottom, middle, or top of the index. As with soil phosphorus, this makes for very interesting reading.
Table 3 – The percentage of soil potassium (K) concentrations at the bottom, middle or top of index scale 2 minus/plus
| Key | Crop | Soil K 2- | ||
| Bottom | Middle | Top | ||
| Greater | 1Grazing | 38 | 31 | 31 |
| Fewer | 1Silage | 39 | 33 | 28 |
| Target | 2Cereals | 39 | 36 | 25 |
| 1soil analysis data from the Southwest of England. Silage sample description (1 or multiple cuts). Grazing circumstance/frequency unknown. | ||||
| 2soil analysis data from the East and Southeast of England. All cereal types included, straw baled | ||||
|
Key |
Crop |
Soil K 2+ | ||
| Bottom | Middle | Top | ||
| Greater | 1Grazing | 35 | 39 | 26 |
| Fewer | 1Silage | 41 | 33 | 26 |
| Target | 2Cereals | 45 | 32 | 23 |
| 1soil analysis data from the Southwest of England. Silage sample description (1 or multiple cuts). Grazing circumstance/frequency unknown. | ||||
| 2soil analysis data from the East and Southeast of England. All cereal types included, straw baled | ||||
In all cropping cases at soil potassium index 2-, more samples skewed towards the bottom, and slightly fewer samples were greater than the middle of the index. The story is similar when examining the distribution of results measured in soil index 2+, where a greater proportion tends to fall towards the bottom.
When you view the soil potassium concentrations across the whole index (2- and 2+) between 66 and 70% of all samples (grass and cereals) were between the top of 2- and the bottom of 2+. This suggests that most soils are being managed at a higher soil potassium concentration (see table 3).
This could be a deliberate approach, or an overestimate of how much potassium is being removed by the crop, or an excess of potassium being applied in fertiliser and/or manure. Fortunately, an excess of potassium in the environment doesn’t have the same consequences as nitrogen or phosphorus, but it does have a financial cost to the farm business.
The distribution trends of magnesium within soil index 2 are quite notable, as concentrations vary between soils used for growing cereal crops and those managed for grassland. Table 4 below illustrates that soils managed for grassland have a higher proportion of samples in the upper range of index 2.
In contrast, soils used for cereal crop production show the opposite trend. Over 50% of the samples from fields growing cereal crops fall within the lower range of index 2, while more than 50% of the samples from managed grassland fields are found in the upper range of index 2.
Table 4 – The percentage of soil magnesium (Mg) at the bottom, middle or top of soil index scale 2
| Key | Crop | Soil Mg – index 2 – (% samples) | ||
| Bottom | Middle | Top | ||
| Greater | 1Grazing | 13 | 32 | 55 |
| Fewer | 1Silage | 16 | 33 | 51 |
| Target | 2Cereals | 60 | 26 | 14 |
| 1soil analysis data from the Southwest of England. Silage sample description
(1 or multiple cuts). Grazing circumstance/frequency unknown. |
||||
| 2 soil analysis data from the East and Southeast of England.
All cereal types included, straw baled. |
||||
Some of the differences in magnesium levels may be due to better access to and more regular application of organic inputs on grasslands compared to soils that grow cereal crops. Additionally, regional geology can impact the content and availability of magnesium in the soil. The type of liming product used, particularly that containing magnesium (magnesium limestone), can also affect magnesium soil content and contribute to the index increasing.
The nutrient management guide (RB209) provides clear advice on applying magnesium to ensure healthy growth of cereal crops. It recommends applying 50-100 kg of MgO per hectare if the soil index is zero. For grassland, it’s crucial to maintain sufficiently high magnesium levels in the soil, especially to protect livestock from health risks such as hypomagnesaemia, commonly known as grass staggers. Therefore, in situations with a high risk to livestock health, it is advised to apply 100kg of MgO at soil index 2.
In the case of magnesium at soil index 2, there is generally no agronomic need to apply a magnesium-containing input, unless you are managing a high-risk grassland farm. However, it is important to note that samples taken from England’s main cereal production regions show that soil magnesium levels are at the lower end of index 2. Therefore, farmers and growers should be aware that nutrient removal rates may be higher than previously assumed. If this is the case, soils could start slipping into index 2, which would put additional pressure on crop productivity.
Soil analysis is one of the most crucial investments a farm business can make, as it forms the foundation for all decision-making related to sustainable production and nutrient management. Soil analysis plays a significant role in successful crop management and is much more cost-effective than buying unnecessary inputs.
To make the most of soil analysis, it’s important to look beyond the basic index and make sure that inputs reflect whether you are at the bottom, middle or top of the index. This involves taking a deeper look at the results and assessing how management decisions may have impacted soil nutrient levels. By doing so, areas where management practices can be changed or improved can be more easily identified.
How NRM can help
NRM offers a range of services that can help you identify potential issues in your soils and crops, allowing you to take prompt action to rectify them. Contact us to learn about how analysis can help you manage your business.
Visit NRM