


ADAS Q&A: the importance of grain analysis

NRM
Agriculture
Q&A with ADAS’ Roger Sylvester-Bradley on the importance of grain analysis
Head of Crop Performance for ADAS
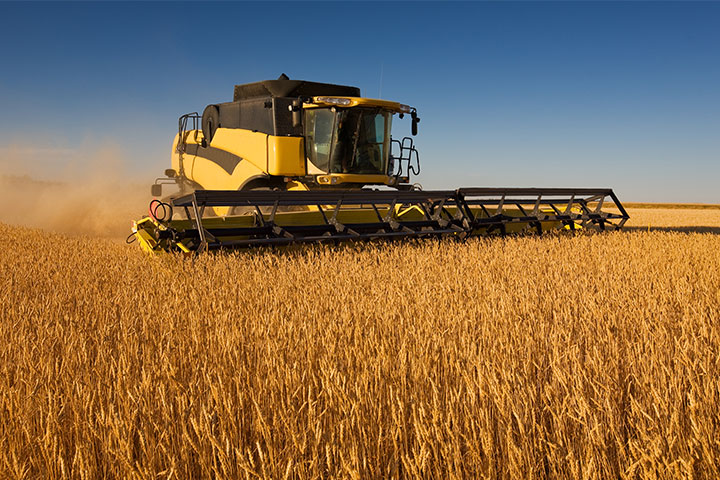
With summer now in full swing, farmers and agronomists will be revving their combine harvesters ready to harvest their grains, pulses and other crops. But how can this year’s harvested crops help us understand the needs of future crops better?
NRM has been working with agricultural and environmental consultancy and research provider ADAS for many years. By providing soil, plant tissue and grain analysis data for various projects, we have helped identify trends in farming to support growers and their advisors in improving farm productivity and provide insight into their crop nutrition plans. We have worked with Roger Sylvester-Bradley, Head of Crop Performance for ADAS, over many years, and since 2013 have sponsored all YEN projects and launched our comprehensive GrainCheck service alongside YEN Nutrition, which encourages farmers to share and benchmark their grain analysis data with the rest of the industry.
We spoke with Roger to get the scoop on recent developments in grain analysis and the importance of sharing data to benefit the whole agricultural industry.
How long have you been looking at grain testing as a way to assess the success of crop nutrition strategies?
Nitrogen has been analysed for many years, mainly to inform farmers and their advisors about the quality of their grain. About fifteen years ago, one of our studies showed that measuring grain nitrogen can also gauge whether a farmer’s nitrogen management plan is working. As a result, the RB209 recommends using grain analysis to check if you have over or under-fertilised the crop with nitrogen, which has proved really useful in telling a story about inaccuracies in nitrogen management. Then, about two years ago, through data provided by NRM and other laboratories, we discovered that grain analysis is actually an effective barometer for phosphorus nutrition as well – as nearly all of the phosphorus taken up from the soil by the crop is put into the grain at harvest.
These two breakthroughs then led to the realisation that grain analysis does not just measure nitrogen and phosphorus, but all twelve essential nutrients for effective crop production. We began to use it as a comprehensive picture of the success of a crop in capturing nutrients, assessing the complete success of a farmer’s crop nutrition strategy. No-one else in the world seems to be using grain analysis at harvest to tell them about crop nutrition in a routine field-by-field way, so these latest developments are truly ground-breaking.
Why should farmers and agronomists consider grain analysis?
Essentially, you won’t know whether you have any nutritional problems until you’ve done grain analysis. Managing your crop nutrition plan is only possible if you monitor many results. This is particularly important as farming is so changeable with elements out of our control, such as the weather. So you need many analyses to get good averages and learn reliable lessons.
Take nitrogen, for example. Nitrogen nutrition usually costs £1,000 to £2,000 in fertiliser per field. But last year, grain analysis indicated that 24% of crops lost more than £300 in profit per hectare due to nitrogen inaccuracy. So, on typical fields, the nitrogen choices you make on your farm have significant risks worth many thousands of pounds. If the farm is currently not undertaking grain analysis every harvest, it doesn’t know if it is gaining or losing these thousands. As grain analysis costs only tens of pounds, it’s a no-brainer! It’s so costly to make these mistakes that I still can’t believe no-one thought of routinely analysing the nutrients in crop products until recently, particularly as nutrient conversion is at the very heart of a farmer’s business.
Where does grain testing fit alongside tissue and soil testing for nutrients? Does it replace the need for these types of tests?
I have worked at ADAS for forty-two years now and helped to produce the official government recommendations for fertiliser management. For all that time, soil testing has been the standard way of managing crop nutrition. However, farmers are recommended to analyse their soil once every three-to-five years and standard soil analysis reports on only three nutrients (and pH) rather than all twelve. So, while soil analysis is useful for benchmarking soil health and tailoring fertiliser requirements to optimise nutrition and yield, it is fairly limiting.
Plant tissue testing helps farmers and their advisors get an initial snapshot of each crop’s nutritional status. It’s a bit trickier to interpret than soil analysis as samples have to be taken very early in the life of the crop. Nutrient uptake predominantly happens later – when the crop is growing fastest—usually from May to June in the UK. Tissue testing helps you to gauge what the crop is getting from the soil, how good its roots are, how much nutrient reserve the crop has before the supply might become critical, so it’s more of a means of predicting what may happen to the crop.
Grain analysis, on the other hand, is undertaken right at the end of the crop’s lifecycle. So, while it can’t tell you how to improve this crop, it is a vital strategic tool to help understand how well a farm’s nutrition management is working generally and for the particular field being analysed. The proof of the pudding is in the eating—if you don’t analyse grain at harvest, you don’t know how successful your crop has been. In my opinion, it’s the definitive final statement of the success of your nutrient management.
Can we use grain analysis to test other types of crops?
Yes—almost everything we can do for grains we can apply to other crops, whether their products are tubers, roots or leaves. I am currently talking to people who are interested in the nutritional analysis of everything that we grow, hence all foods that everyone eats. In the future, analysis at harvest could become dual-purpose – informing farmers about the nutritional efficiency of their crops and informing the rest of us about the food that ends up on our plates at home.
What is YEN Nutrition and how can it benefit farmers and agronomists?
With 12 different essential nutrients, you have to recognise that nutrition is complicated. Combine this with the number of different crops and the variable ways that different soils behave, and you’ve got so many potential outcomes. Our YEN Nutrition network tries to resolve these complexities by connecting farmers, advisors, suppliers and anyone else who wants to improve the nutrition of their crops. NRM has supported our various YEN projects since 2013, including YEN Cereals, OSR, Pulses, and Grass, and most recently, YEN Nutrition, by providing soil and grain analysis data, as well as their decades of expertise. We created YEN Nutrition to encourage the sharing of grain analysis data within the agricultural industry and enable independent and comprehensive nutrition benchmarking against other crops to help reduce uncertainty.
My decades working with ADAS means that I know about the power and implications of sharing data. The thousands of data from YEN are currently telling me that crop nutrition is in a bit of a mess. Most farmers currently don’t measure the success of their nutrition plans, and when they do, they see huge farm-to-farm variability. Last year we found the ‘farm effect’ to be the biggest feature of yield and nutritional variation — overall, despite some effects of soil and crop type, nutrient status often comes down to how the farmer chooses to manage his or her own farm. So, by comparing their farm against others across the country or region, a farmer can tell if they are high, low or middling for each nutrient for each of their crops and adjust their plans accordingly.
What can you tell us about grain testing trends over the last couple of years? What interesting findings have you discovered?
Last year, the number of samples received by YEN Nutrition rose to over 800, massively improving our overview. For me, the most interesting thing that’s come out of all this grain testing is that, while most soils demonstrate adequate phosphorus levels, most crops don’t. We always respected the importance of getting nitrogen right, but now we are also seeing the obvious importance of finding more efficient ways of getting phosphorus into our crops – whether this means more attention to rooting or more direct nutrition, say by foliar feeding, we don’t yet know.
Another interesting finding last year was that, overall, manganese levels in barley were very low compared with wheat. Currently, we don’t know the reason for this — maybe barley is good at making do without manganese, or perhaps it’s poor at taking it up from the soil. There’s nothing in any of the literature I’ve read that provides an explanation, and with more years of grain analysis we can discover and resolve these mysteries.
How many tests should a farmer do? One for every field, more, or less?
Usually, farmers should take one sample per field, because nutrition is generally managed field-by-field. Sampling sub-field zones will generally be more expensive, so we probably need to develop new approaches for this.
Sampling grain is a much more precise business than sampling soil. By taking two handfuls out of each trailer load when it arrives at the grain store, mixing it up in a bucket and taking out a handful to send to the lab, you can get a much more precise representation of what that whole field has achieved than by sampling in W pattern for soil or walking up and down tramlines for plant tissue analysis.
What can the agricultural industry to do make grain nutrition testing more useful for farmers and their advisors?
One thing that’s been on my mind for a while is the concept of critical values. These are crucial in helping customers interpret lab results. But to produce critical values, many experiments are needed over a decent number of years and many sites and each must show a response to treatment. Other than nitrogen, these experiments have been conducted rarely in the past. But now, if many more growers are analysing grain and testing products, perhaps we could have annual meetings to discuss their findings and promote the learning process for the whole of the agricultural industry. It’s going to be a long learning process, and it won’t be perfect due to the weather and some fertilisers and crops not responding as we expect them to, but the picture will only get clearer as time goes on.
What do you want farmers to take away from our discussion?
Essentially, grain analysis is a new discovery, and we need to recognise that there’s a whole learning journey ahead of us. Sharing our data between farmers, agronomists and industry bodies is a fantastic first step to speed our way on that journey.
NRM’s top five takeaways
Takeaway #1: Grain analysis is a vital strategic tool required for efficient crop production.
Takeaway #2: Nitrogen deficiency in the crop, measured by grain analysis, is one of the costliest mistakes a farmer can make.
Takeaway #3: While grain analysis provides a comprehensive post-mortem of a crop, it does not fully replace soil or plant tissue testing. It is best to use all three for the best picture.
Takeaway #4: Grain analysis has allowed trends in nutrient levels to become apparent that were never discovered before, providing more insight into crop nutrition management.
Takeaway #5: Sharing information within the agricultural industry is the first step on the learning journey kickstarted by grain analysis findings and will make the most of the data collected.
With harvest just round the corner, now is the time to plan the collection of grain samples, and to discuss with your agronomist or contact NRM directly to arrange for analysis.
We will supply everything you need to take your samples. Get in touch now on 01344 886338 to request a sample kit or speak to your agronomist to book our comprehensive GrainCheck service today.
NRM supports YEN Nutrition which enables you to benchmark your results against the thousands of other grain analyses in the YEN database – see details at www.yen.adas.co.uk/projects/yen-nutrition
Visit NRM