


Grain analysis data: the nutrient status of crops

NRM
Agriculture
Farmers are encouraged now more than ever to measure all aspects of the crop production process, from the soil and inputs to plant tissue and grain. NRM’s extensive datasets from farms across the UK, which have been collected over decades, place us in a unique position to analyse trends in how effectively crops are capturing nutrients within and across different seasons. This is great for understanding national and regional trends, but for individual farms, knowing the grain nutrient content through grain analysis data can help guide decision-making and indicate the impact of previous decisions made.
Read on to find out more about the national trends and how NRM’s handy GrainCheck calculator can help you calculate how much nitrogen, phosphate, potash and magnesium has been removed by the crop.
The importance of grain analysis data and the national picture
It’s important to emphasise that grain analysis is all about gauging crop performance, serving as a key indicator of the effectiveness of management decisions. The accuracy and reliability of results are fundamental to every analysis service. Laboratories work diligently to ensure these standards, giving you the confidence to make informed decisions. This helps you determine whether management changes have led to improved quality, higher yields, or more efficient use of inputs, while also reducing environmental risks.
Conducting an extensive data analysis also serves as evidence on how well our industry is performing in terms of nutrient use efficiency (NUE). The introduction and use of inorganic fertilisers over the past 50 years has been revolutionary, significantly impacting crop yields and quality. However, this advancement has come at a cost to the environment and the natural systems on which agriculture depends. Farm businesses are constantly encouraged to review how they operate to minimise the cost of production, but wholesale changes from a known system to one perceived as unknown or adding another variable to manage can be challenging. To help make the review process easier, grain analysis serves as a good benchmarking tool.
Additionally, understanding the bigger picture allows individual farmers to benchmark performance against what the industry is achieving regionally and nationally. This is an effective way to validate nutrient management decisions, while also supporting the use of inputs and the integration of nutrients from organic sources.
How can grain analysis data help?
Understanding how effectively a crop has utilised nutrients at a specific yield is crucial for replenishing the soil’s nutrient supply. This practice supports the future requirements of the next crop and helps, reduce, maintain or build the soil index.
While guidance in RB209 provides information on the removal rates of key nutrients, such as phosphate and potash, this advice is based on average values found per tonne of fresh crop material. Whilst this method is useful as a nationwide average, knowing the exact amount of nutrients your crop has removed at the end of the season is valuable. This information allows for a farm-specific approach to managing soil indices.
For instance, higher overall yields will result in the removal of more phosphate and potash. However, by analysing the grain from your farm, you can also better understand how effectively the soil-plant system is working. Additionally, knowing the nutrient concentration within the grain is essential, as it may differ from the standard guidance.
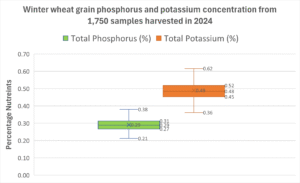
The chart below shows the distribution of phosphorus (P) and potassium (K) concentrations measured in more than 1,750 wheat grain samples harvested in 2024. As you can see, the median value for P is slightly lower at 0.29% than RB209’s advised figure of 0.32%. Grain nutrient content that is reported repeatedly below 0.32% for P, for example, could indicate that yield has been affected by reduced uptake by the plant.
The median value for K was 0.48%, with a range between 0.36 and 0.62%. The critical grain value for K (as defined by ADAS) is 0.38%. This level will have a degree of uncertainty attached, so should be applied cautiously.
The phosphate and potash offtake, as well as the amount of nutrients removed by the grain, can be calculated using this grain analysis data.
When examining the table below, it is intriguing to note the differences between the NRM grain analysis data and the typical kg/t values. The calculated values in the table, based on measured median sample values, are pretty similar to RB209 values. However, they do indicate a slightly increased grain offtake of both potash and phosphate.
Comparison between analysis and guide figure: 8.0t/ha yield 15% moisture, grain only
| Crop | RB209 guidance values kg/t | Values based on analytical measurement (NRM) kg/t | ||
| Phosphate | Potash | Phosphate | Potash | |
| Winter Wheat | 5.5 | 4.7 | 5.6 | 4.9 |
Based on NRM wheat grain analysis 2024 (1,750 samples). P median value 0.29%. K median value 0.48%. Grain yield at 15% moisture content. RB209 kg/t fresh values adjusted to yield at 85% DM for comparison.
Use NRM’s innovative GrainCheck calculator for grain analysis data
To calculate the crop offtakes based on laboratory analysis and the actual crop yield, the following formula can be applied:
Nutrient removal = fresh yield * P/K % content * conversion factor
The conversion factor accounts for adjusting the fresh yield (t/ha) to 15% moisture, converting the percentage of nutrients in grain to kilograms per tonne, and converting the nutrient element to its oxide.
Conversion factor = (85/100 * 10) * 2.291 [P205] or 1.205 [K2O]
Don’t worry: you don’t have to calculate this all yourself. Use NRM’s handy GrainCheck calculator instead.
NRM has created an easy-to-use nutrient offtake calculator as part of its GrainCheck service:
- To use the calculator, enter the yield, grain moisture at harvest, and the analytical results.
- The output will show the calculated phosphate and potash offtake (kg/ha) removed by the grain alone.
- Note that the phosphate and potash contained in the straw are not included in this calculation, but these amounts should be estimated if you plan to bale and remove the straw from the field.
Guide figures for situations where both grain and straw are removed can be found in RB209. Typically, the straw yield is assumed to be 50% of the grain yield. However, if the actual straw yield is known, standard offtake figures can be applied for more accurate calculations.
It’s also important to consider that potash concentrations in straw can significantly decrease between crop maturity and harvest, especially considering the amount of rainfall received during this period. Therefore, it’s advisable to determine the nutrient content by taking a representative sample and sending it to a laboratory for analysis.
Comparing your results to the typical averages can provide insight into how effectively you are managing nutrients. If your grain concentrations and offtake levels differ from your expectations, it may prompt you to investigate further.
Remember that no single analysis result should be viewed in isolation; it is often beneficial to look at other measurements as well. This comprehensive approach can lead to a more in-depth understanding of soil nutrient supplies, the balance of nutrients in the soil, and how inputs are utilised.
With harvest underway, now is the time to plan the collection of grain samples. For more information or to arrange analysis, speak with your agronomist or contact NRM directly.
References
Nutrient Management Guide (RB209)
Cost effective phosphorus management on UK arable farms (2019), Grain Nutrient Benchmarking (GNB), A. Rollett & R. Sylvester-Bradley. Project code PR-570
Visit NRM