



Irish soil data analysis 2023-2024 part 2: phosphorus

IAS
Agriculture
If you farm in Ireland, you may be wondering how your soils are faring in comparison with the rest of the country.
Last week, we dove into IAS Laboratories’ Irish soil data findings from the analysis of 45,000 soil samples collected across Ireland between June 2023 and May 2024, as well as critical insights into soil pH. If you haven’t read part 1 of this blog series already, you can read it here.
Today, let’s talk about phosphorus, recommended levels in Ireland, what farmers can do to ensure optimal phosphorus levels, and how we can help.
A recap of our key findings:
- Soil pH: The average soil pH was 6.4, close to the ideal range for crop and grass/clover growth (6.2–6.5). However, 37% of samples fell below pH 6.0, indicating a need for liming or other corrective measures in many fields.
- Soil phosphorus: Around 63% of the soils tested were deficient in phosphorus (falling into Index 1 or 2), which can limit crop yields. Only 22% were in the optimal range (Index 3), and 15% had excessive phosphorus levels (Index 4), posing potential environmental risks.
Irish soil data: phosphorus and recommended levels in Ireland
Soil phosphorus (P) recommendations are based on a P index system developed by Teagasc (Table 1). The system categorises the soils into four indices depending on their content:
- Index 1 soils (very low P) are severely deficient in phosphorus, and greater phosphorus applications are recommended to build up soil reserves.
- Index 2 soils (low P) are also deficient, though less so than Index 1. Moderate phosphorus application is advised to raise the levels to an optimal range.
- Index 3 (moderate P) is considered the optimal range for most crops. Phosphorus application should only replace what is removed by the crop/grass during harvesting.
- Index 4 (high P) soils have more P than required for crop production. No additional P should be applied, as excess phosphorus can lead to environmental issues.
| Table 1: Soil nutrient Index, response to fertilisers and soil test range for P, K and Mg. (Source: Teagasc) | ||||
| Soil Index | Response to | P (mg L1) | P (mg L1) | K |
| Fertilisers | Grassland | Tillage | (mg L-1) | |
| 1 | Definite | 0- 3.0 | 0-3.0 | 0-50 |
| 2 | Likely | 3.1- 5.0 | 3.1- 6.0 | 51-100 |
| 3 | Unlikely/Tenuous | 5.1- 8.0 | 6.1-10.0 | 101-150 |
| 4 | None | > 8.0 | >10.0 | >150 |
Source: Teagasc, Agriculture and Food Authority, Ireland
Irish soil data: soil phosphorus
Our Irish soil data represents a diverse range of agricultural land, but detailed information on specific sample locations is limited. For analysis purposes, we have assumed a weighted distribution where 80% of the samples are from grassland soils, reflecting Ireland’s primary land use, while 20% are from tillage soils, which aligns with national land-use statistics. This assumption aims to reflect a realistic approximation of soil nutrient trends across Ireland’s agricultural landscape. Consequently, findings should be viewed as indicative rather than definitive for each specific land type, given these generalisations in the data’s origin and composition.
Figure 3 below shows the distribution of soil phosphorus levels across grassland and tillage soils classified into four phosphorus indices.
The Irish soil data results show that around 29% of the soils fall into Index 1, indicating very low phosphorus levels. These soils are significantly deficient and will require greater phosphorus supplementation to support crop or grass growth. A further 34% of the soils were at Index 2, increasing further the total number of soils with phosphorus levels below optimal. Index 2 soils aren’t as severely deficient as Index 1 soils, but these soils need and would still benefit from targeted phosphorus applications. Farmers and advisers managing these soils should aim to gradually increase soil phosphorus levels to bring them closer to optimal.
The results in Figure 3 also show that only 22% of the soils were found to be in Index 3, where phosphorus levels are considered optimal. These soils are well-balanced for crop and grass growth and do not require additional phosphorus inputs for the time being. It is important to maintain this balance through matching inputs with outputs to avoid soil nutrient excess.
Finally, 15% of soils were in excess at index 4, and in these cases, further phosphorus applications should be avoided, to reduce the environmental risk of nutrient runoff and avoid unnecessary costs. It is essential to review these soils more frequently to monitor the reduction of the soil index back to index 3.
Figure 3: Soil phosphorus levels in Ireland: percentage analysis for 2023-24
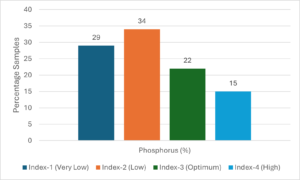
This data indicates that a significant portion (two-thirds) of agricultural soils may be suboptimal for grass/clover crop growth, as low phosphorus levels can limit plant development and yield.
What can farmers do to ensure optimal phosphorus application?
Regular soil testing is essential to ensure phosphorus is applied efficiently, avoiding over-supply to fields already at high or very high levels (Index 3 and above). Over application clearly leads to water quality issues like water contamination, eutrophication and algal blooms.
Farmers should consider targeting phosphorus applications to soils that require the greatest levels of phosphorus input (ones that have low and very low levels of phosphorus). These applications can either be supplied through organic inputs such as livestock manure and slurry and/or by inorganic fertilisers.
Implementing precision agriculture practices (variable rate applications) can help better target phosphorus inputs with crop needs, optimising both productivity and sustainability. Additionally, cover crops during fallow periods can reduce phosphorus loss through erosion and runoff. They take up excess phosphorus in the soil, storing it in their biomass. When these plants decompose, they release the nutrients back into the soil, making them available for future crops.
In grassland, reseeding in August or spring minimises nutrient loss by avoiding the heavy rainfall typical of autumn, which often leads to phosphorus runoff. Including a diverse species mix of plants with various root structures improves soil structure and promotes deeper root systems, enhancing nutrient cycling. Species with deep taproots, such as chicory or plantain, for instance, can access phosphorus from lower soil layers and bring it to the surface, where it becomes available to other plants. Additionally, plants with fibrous roots help stabilise the soil and reduce erosion, which is a key factor in phosphorus loss from runoff.
How IAS can help
Our various soil analysis suites enable you to benchmark and improve soil health, plan crop nutrition, save money and maximise profitability.
We make the whole process easy for you:
- We provide a free sample kit containing everything you need for analysis including sample bags, a delivery envelope, an analysis request form, and full instructions on taking and sending samples.
- Results are reported within 10 working days from the time of registration, in an easy-to-understand visual format so nutrient adequacy can be determined quickly.
Contact us or speak to your advisor direct to receive your free soil sampling kit today.