


How to make the best use of manures this season #2

NRM
Agriculture
It’s important to understand how always relying on the standard values of nutrients in manures and slurries could be impacting your crops and your profitability this season. If you base your plans on these standard values alone, you could be over or undersupplying nutrients. The only way to be sure is through analysis by an accredited laboratory.
I discussed NRM’s latest manure and slurry data in part 1 of this blog. Find out more about the sustainable use of organic materials and how RB209 standard values correlate to analytical results here.
Read on to find out more about nutrient distribution, integrating manure into Nutrient Management Plans, and how NRM can help.
Nutrient distribution
The total variation seen in laboratory measured manure samples can be immense due to host of farm factors, such as its type and age, how the manure has been stored, how dilute, and the diet of the animal, to mention just a few.
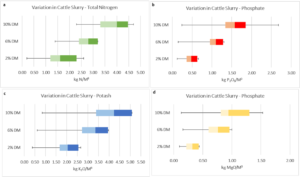
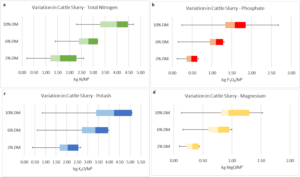
The following charts describe the distribution of nutrients measured in either 2, 6, or 10% dry matter cattle slurry. These charts are a good way at visualising the distribution in measured concentrations. In simple terms, the box represents the majority of measured values. The left edge of the box represents where the lower 25% of the measured values fall, and the right edge of the box represents where the upper 25% of the measured values fall. The median or middle value is represented by the central line.
The figures below clearly show that, as the dry matter content increases, so does the concentration of nutrients within the slurry. However, variation still exists within and between the different dry matter groups.
It is also clear that, within each dry matter group, the nutrient distribution can be wide and often reaches or overlaps the nutrient concentration measured at a higher or lower dry matter slurry. For example, this indicates that a thinner slurry (2%) can contain the same concentration of nutrients as a thicker dry matter slurry (6%). If you assume a thinner slurry is always less concentrated, you could be at risk of over supplying nutrients.
Analysis of cattle slurry (2535 samples, 2019 to date)
Regularly measuring slurries removes some of the uncertainty around nutrient supply. While standard figures suggest that nutrient supply increases with dry matter percentage, in all cases there is always a chance that might not be true. Without analysis, you can’t be certain that a 2% DM slurry definitely contains less nutrients than a 6% slurry, or that a 10% slurry definitely contains more nutrients than a 6% slurry. Analysis identifies those samples that don’t represent the average.
Integrating manure into Nutrient Management Plans
If you are applying livestock and/or organic manures to land, you must take the nutrients they supply into account. This is critical in meeting the Farming Rules for Water regulations, NVZ regulations, and the code of good agricultural practice.
Choosing when, where and how you apply them has a huge impact on how available the nutrients are and how efficiently the crop can use them. Planning their use in advance and assessing the risk of applications is important if you are to get best use out of them.
Defra will now pay for a visit from a FACTS qualified adviser under the SFI scheme. Taking advice from an expert can be the difference between the best and worse use of manures, and considering that the cost could well be covered by the SFI scheme, it’s worth taking a look. Click here to understand more about SFI nutrient management.
How NRM can help
NRM offers a range of analytical services and can help you get the most out of your livestock and organic manures. To understand more about how analysis can help, speak to your advisor or contact NRM. You can request sampling supplies on our website here.
Visit NRM