



Are your crops capturing the nutrients they need?

NRM
Agriculture
Are your crops capturing the nutrients they need? If so, maybe they’re not getting them when they need them.
Generally, plant tissue analysis is only used when growth issues or deficiencies are seen in the crop, and therefore understanding the plant’s nutrient status is important so action can be taken. However, these analysis results are only ever benchmarked against generic critical values which don’t account for the development stage of the crop.
Now, growers can go a step further.
CropCheck is the next innovative step in plant tissue analysis, which tells you not only what is in the crop, but how that compares to what you should expect at a particular growth stage. NRM’s expert agronomists have identified specific nutrient adequacy ranges for cereal crops at key growth stages coinciding with fertiliser application timings. This means fertiliser plans can be adjusted if necessary to rectify any deficiency issues.
Key Growth Stages (GS) and capturing the nutrients the crops need
Identifying plant growth stages correctly is important when sending samples into the lab for analysis. This is because the critical values that the results are benchmarked against are specific to that point in the crop’s development.
CropCheck provides specific nutrient adequacy levels for cereal crops between GS30, when the ear is at 1cm, and between GS32, when the 2nd node is detectable, and GS37, when the flag leaf is just becoming visible.
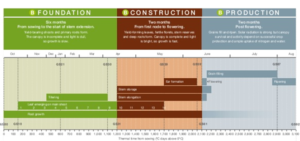
The key development periods for cereals are:
- Foundation stage – emergence to the start of stem extension
- Construction stage – from first node to flowering
- Production stage – post flowering.
The duration of each phase is governed by day length, temperature, and the crop’s need for vernalisation below 12oC. Most growth occurs in any phase during cooler temperatures, and day length affects the duration of both the foundation and construction phases.
The image below describes how thermal temperature since sowing impacts crop growth and when growth stages are likely to be reached.
The handy graphics below describe the growth stages when tissue analysis results can be benchmarked against specific critical values.
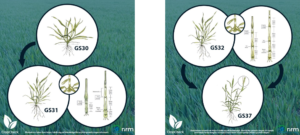
Growth Stage 30
Ear at 1cm
Growth Stage 32
Second node detectable 2nd and subsequent nodes counted when the internode below them exceeds 2cm.
Growth Stage 37
Flag leaf just visible
Weather conditions and crop development
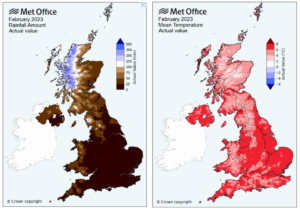
Since the turn of the year, the weather conditions have been relatively dry and mild. In fact, we have seen the driest February for 30 years, and the fifth mildest since records began in 1884. However, March has started off chillier, with many places in the UK seeing rain, sleet, and snow. These conditions are likely to slow down crop development and may delay the time it takes to reach the critical growth stages.
However, this often means that when the soil and air temperatures do begin to climb, rapid growth quickly follows and crops romp through the growth stages. So, it’s best to be extra observant, take time to plan, and ensure that samples are taken at the optimal time for the best results and maximum benefit.
The Met Office charts below illustrate the reduced amount of rainfall and the average temperatures experienced across the UK in February. February was a mild month, especially further north, despite colder spells from the 5th to 9th and from the 23rd onwards. Mean temperatures for the month were well above average. We saw a provisional UK mean temperature of 5.8 °C, with some 1.7 °C above the 1991-2020 average.
Over December and January, England also experienced between 70 and 110% of their usual long-term average rainfall.
These weather conditions will contribute to the speed of crop development to date and explain some of the geographical spread in crop growth stage variation.
How could climate change affect crops in the future?
A recent study by L J Slater et al looked at the resilience of UK crop yields in a changing and compounding climate. It determined that the volatility in crop yields is only partially explained by seasonal weather metrics, such as temperature and rainfall, across the key growth stages. The study concluded that the increase in wheat yield volatility was the greatest in years where severe weather conditions, such as frosts and heavy rainfall, compounded across the key growth stages.
The same study went on to assess how weather conditions might evolve in the future. It stated that, on average, the foundation stage (between 1st October – 9th April) is likely to become warmer and wetter, whilst the construction (10th April – 10th June) and production stages (11th June – 26th July) are likely to become drier and warmer. The impact of this at a regional scale suggests that these changing climate conditions maybe more advantageous for our crops than previously thought. However, the authors stress that the impact of moving away from typical UK conditions and towards a climate of prolonged drought and intense localised thunderstorms can’t be underestimated.
With the risk of more unpredictable weather patterns on the horizon, it is important to ensure that we incorporate resilience strategies into our crop management plans. Protecting the soil and its health and monitoring crop growth can guide how we react to the effects of a changing climate on crop productivity. Using crop measurements and innovative analyses to guide our management decisions is part of building resilience and sustainability in our growing systems.
Send in samples for CropCheck today
CropCheck is available for a broad range of cereal crops including winter and spring barley, winter and spring wheat, winter and spring oats, and rye. Growth stages range from GS30 to GS37.
NRM provides a sample kit which contains everything needed to place an order for CropCheck analysis. This comes with an analysis request form, sample bags, sample posting envelope, and full instructions on how samples should be taken, prepared, and despatched to the laboratory.
Results are reported in an easy-to-understand visual format so nutrient adequacy can be determined quickly. Interpretation is also provided to guide why nutrients might be high or low.
You can order your kit through your agronomist, at cawood.co.uk/order-sample-kits. Alternatively, contact NRM customer services on 01344 886 338 or at enquiries@nrm.uk.com.
References
Wheat growth guide: Growth guides for wheat, barley and oilseed rape | AHDB
Resilience of UK crop yields to compound climate change: https://doi.org/10.5194/esd-13-1377-2022
UK climate averages – Met Office
Visit NRM